Fig. 12.
Download original image
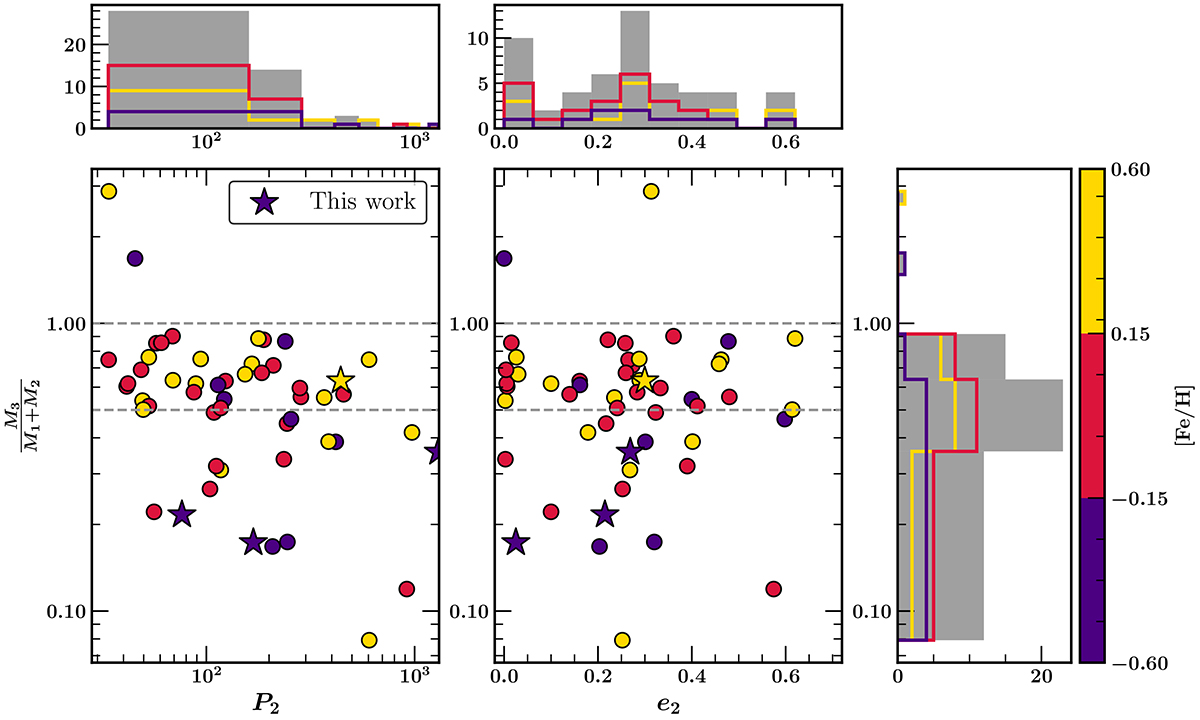
Distribution of the tertiary mass-ratio (![]() ), the tertiary period (P2), and the eccentricity (e2) of the outer orbit for CHTs with metallicity estimates. The left panel shows the distribution of
), the tertiary period (P2), and the eccentricity (e2) of the outer orbit for CHTs with metallicity estimates. The left panel shows the distribution of ![]() and P2. The right panel shows the distribution of
and P2. The right panel shows the distribution of ![]() with e2 of the outer orbit. The points have colours according to their systemic metallicity, where metal-poor (< −0.15 dex) systems are purple, near solar-metallicity (−0.15 dex < [Fe/H] < 0.15 dex) ones are red, and metal-rich (> 0.15 dex) CHTs are yellow. The narrow panels on each axes represent the histograms of the respective parameters, with the coloured histograms representing the distributions for each metallicity group.
with e2 of the outer orbit. The points have colours according to their systemic metallicity, where metal-poor (< −0.15 dex) systems are purple, near solar-metallicity (−0.15 dex < [Fe/H] < 0.15 dex) ones are red, and metal-rich (> 0.15 dex) CHTs are yellow. The narrow panels on each axes represent the histograms of the respective parameters, with the coloured histograms representing the distributions for each metallicity group.
Current usage metrics show cumulative count of Article Views (full-text article views including HTML views, PDF and ePub downloads, according to the available data) and Abstracts Views on Vision4Press platform.
Data correspond to usage on the plateform after 2015. The current usage metrics is available 48-96 hours after online publication and is updated daily on week days.
Initial download of the metrics may take a while.