Open Access
Fig. 8
Download original image
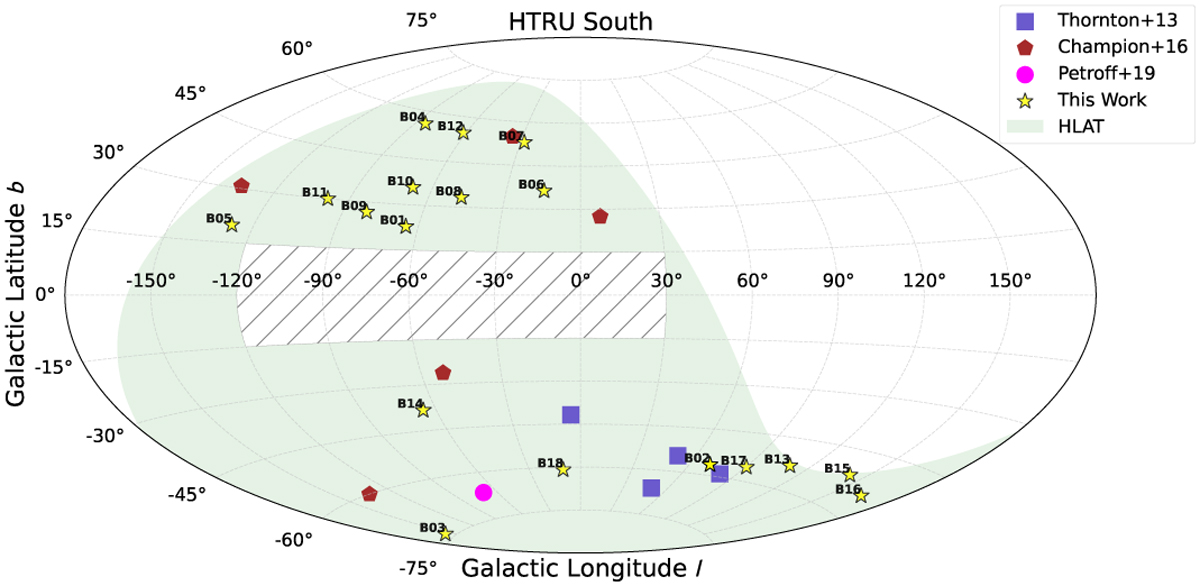
Sky distribution (Aitoff projection) of the bursts detected in this work via the sub-banded search of HTRU HiLAT. For comparison, the bursts from Thornton et al. (2013); Champion et al. (2016); Petroff et al. (2019) are also plotted.
Current usage metrics show cumulative count of Article Views (full-text article views including HTML views, PDF and ePub downloads, according to the available data) and Abstracts Views on Vision4Press platform.
Data correspond to usage on the plateform after 2015. The current usage metrics is available 48-96 hours after online publication and is updated daily on week days.
Initial download of the metrics may take a while.