Fig. 7
Download original image
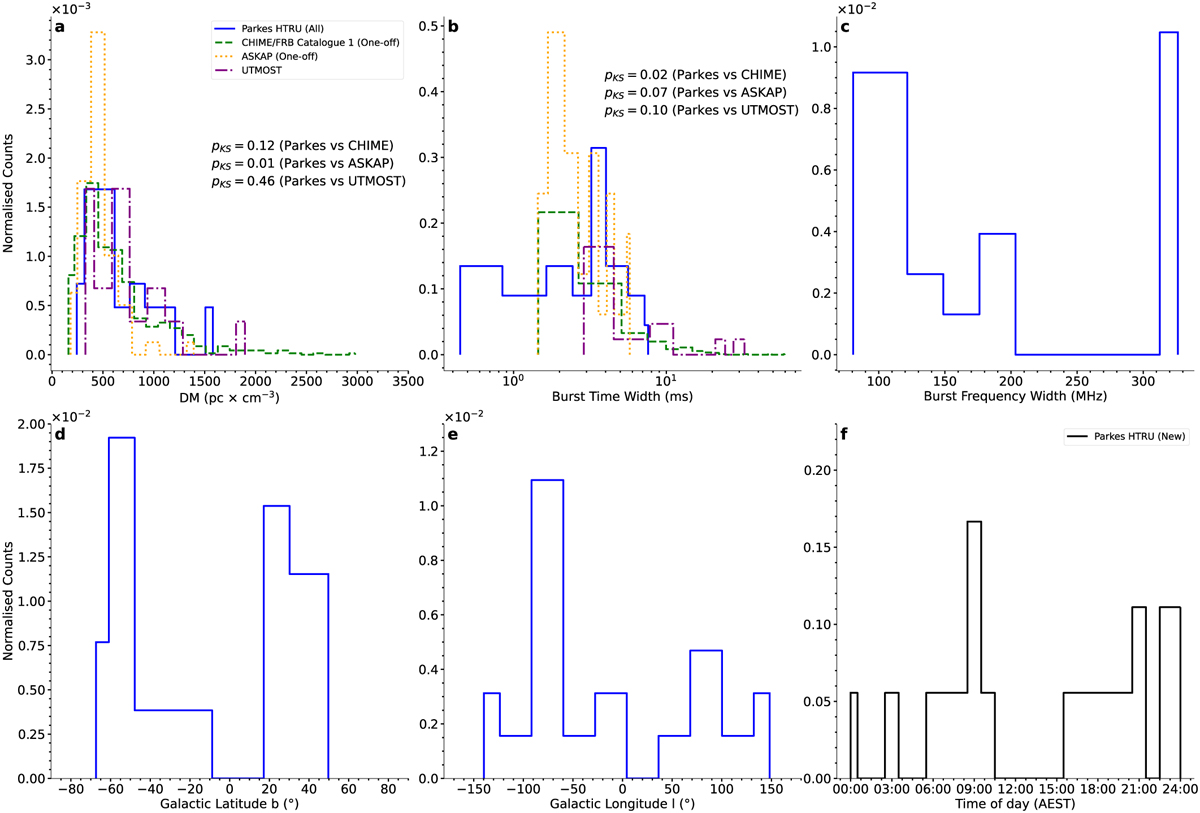
Distributions of DM (a), burst time width (b), burst frequency width (c), Galactic Latitude b (d), and Galactic Longitude l (e). The Parkes sample (blue) consists of our 18 detections along with the 10 already discovered FRBs in this survey (Thornton et al. 2013; Champion et al. 2016; Petroff et al. 2019). For subplots (a, b), we also display, for comparison, the distribution obtained by considering the sample of the one-off FRBs published by CHIME (green, CHIME/FRB Collaboration 2021), the distribution of the sample of ASKAP one-off FRBs (orange, Shannon et al. 2018; Bannister et al. 2019; Macquart et al. 2019; Prochaska et al. 2019; Bhandari et al. 2023; Ryder et al. 2023), and the sample of FRBs detected by UTMOST (violet, Caleb et al. 2017; Farah et al. 2019; Gupta et al. 2019a,b,c, 2020a,b; Mandlik et al. 2021, 2022). For each pair of histograms in each subplot, we report the Kolmogorov-Smirnov probability pKS of being drawn from the same distribution. Panel (f) shows the distribution of the newly detected burst arrival times in AEST local time.
Current usage metrics show cumulative count of Article Views (full-text article views including HTML views, PDF and ePub downloads, according to the available data) and Abstracts Views on Vision4Press platform.
Data correspond to usage on the plateform after 2015. The current usage metrics is available 48-96 hours after online publication and is updated daily on week days.
Initial download of the metrics may take a while.