Fig. 6
Download original image
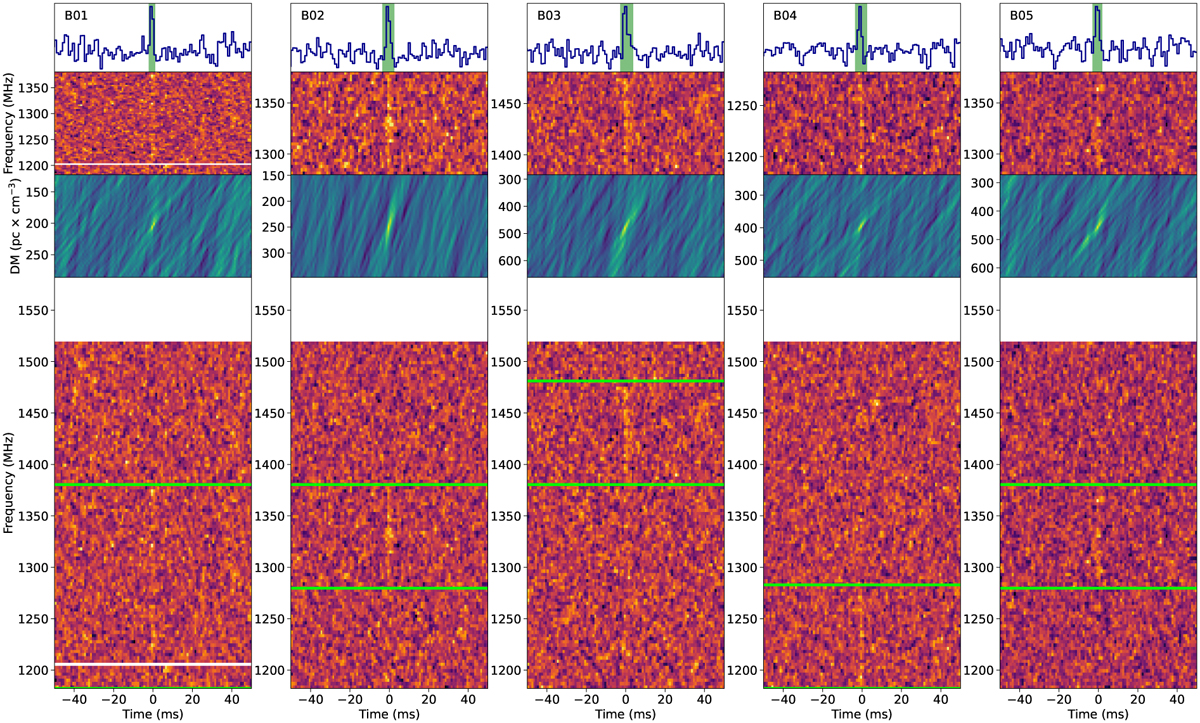
Narrow-band bursts detected in the HTRU HiLAT sub-band search. Here, we display the five highest sub-band S/N (see Appendix C for the remaining candidates). For each burst, the bottom panel shows the dedispersed waterfall plot of the data, with two green lines delimiting the sub-band area in which the burst has been detected. The central lower panel shows the DM-time (butterfly) plot of the burst, and the central upper panel is the waterfall plot of the sub-banded dedispersed data. Lastly, the top panel shows the frequency-averaged time series along the sub-band. The blank rows in all the waterfall plots represent excised channels due to RFI.
Current usage metrics show cumulative count of Article Views (full-text article views including HTML views, PDF and ePub downloads, according to the available data) and Abstracts Views on Vision4Press platform.
Data correspond to usage on the plateform after 2015. The current usage metrics is available 48-96 hours after online publication and is updated daily on week days.
Initial download of the metrics may take a while.