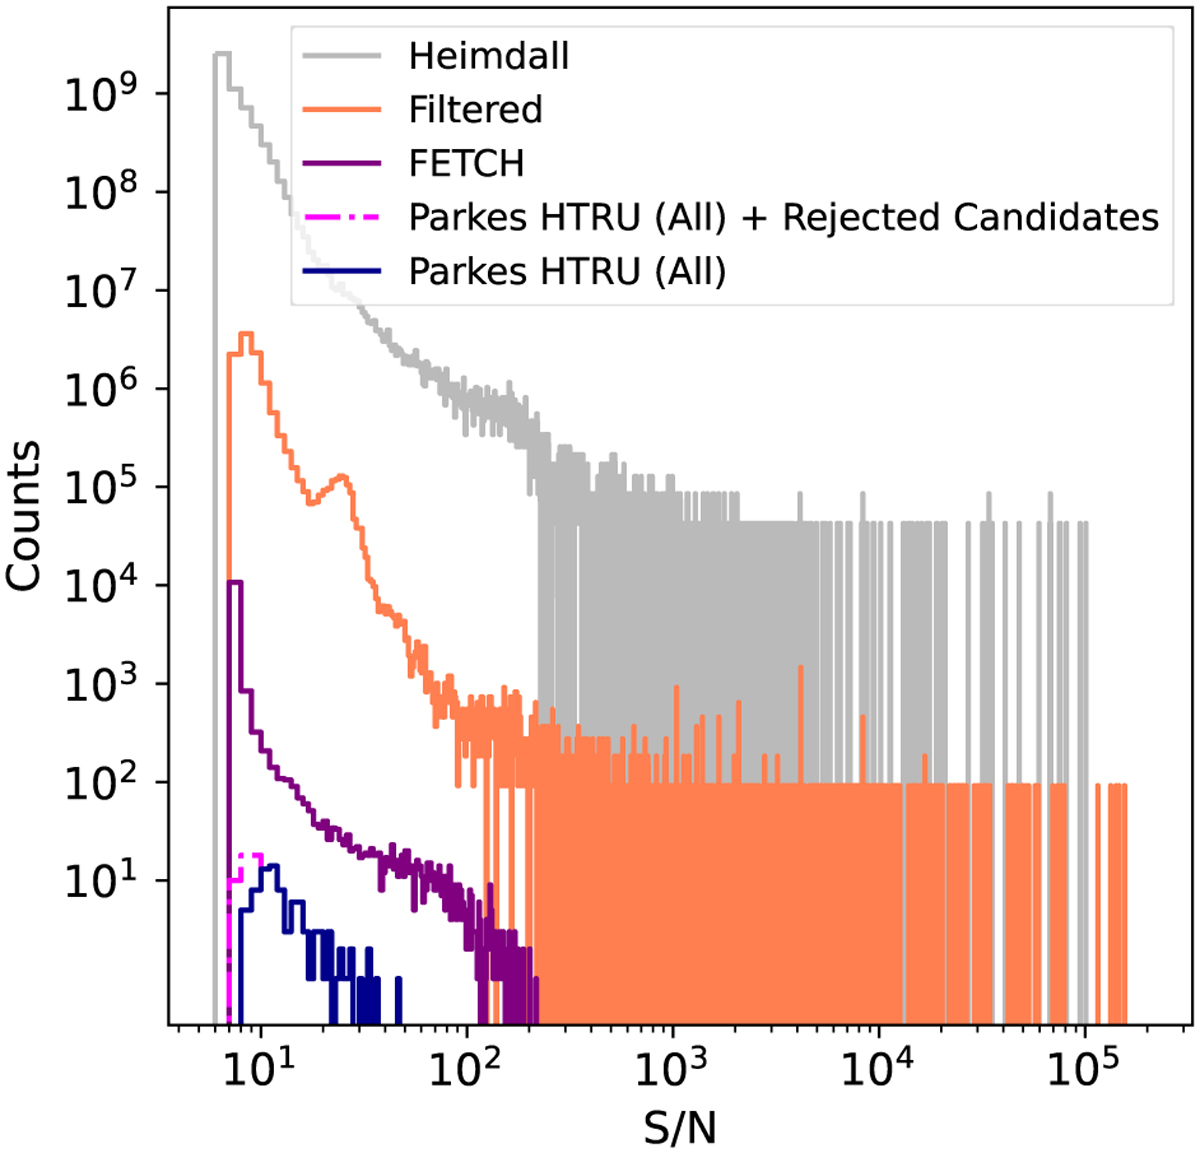
Fig. 4
Download original image
S/N distributions (binned with an S/N bin size of 1) of the candidates: in grey, those initially detected by HEIMDALL; in coral, the HEIMDALL candidates filtered according to the criteria listed in Eq. (5); in purple, the filtered candidates positively classified by FETCH; in magenta, the sample of our 51 detections along with the 10 previously discovered FRBs in this survey (Thornton et al. 2013; Champion et al. 2016; Petroff et al. 2019, including detections in multiple sub-bands); and in blue, the same distribution as the magenta one, but with the sample of our detections limited to events with S/N ≥ 10 (see Sect. 4.2 for more details).
Current usage metrics show cumulative count of Article Views (full-text article views including HTML views, PDF and ePub downloads, according to the available data) and Abstracts Views on Vision4Press platform.
Data correspond to usage on the plateform after 2015. The current usage metrics is available 48-96 hours after online publication and is updated daily on week days.
Initial download of the metrics may take a while.