Fig. 2
Download original image
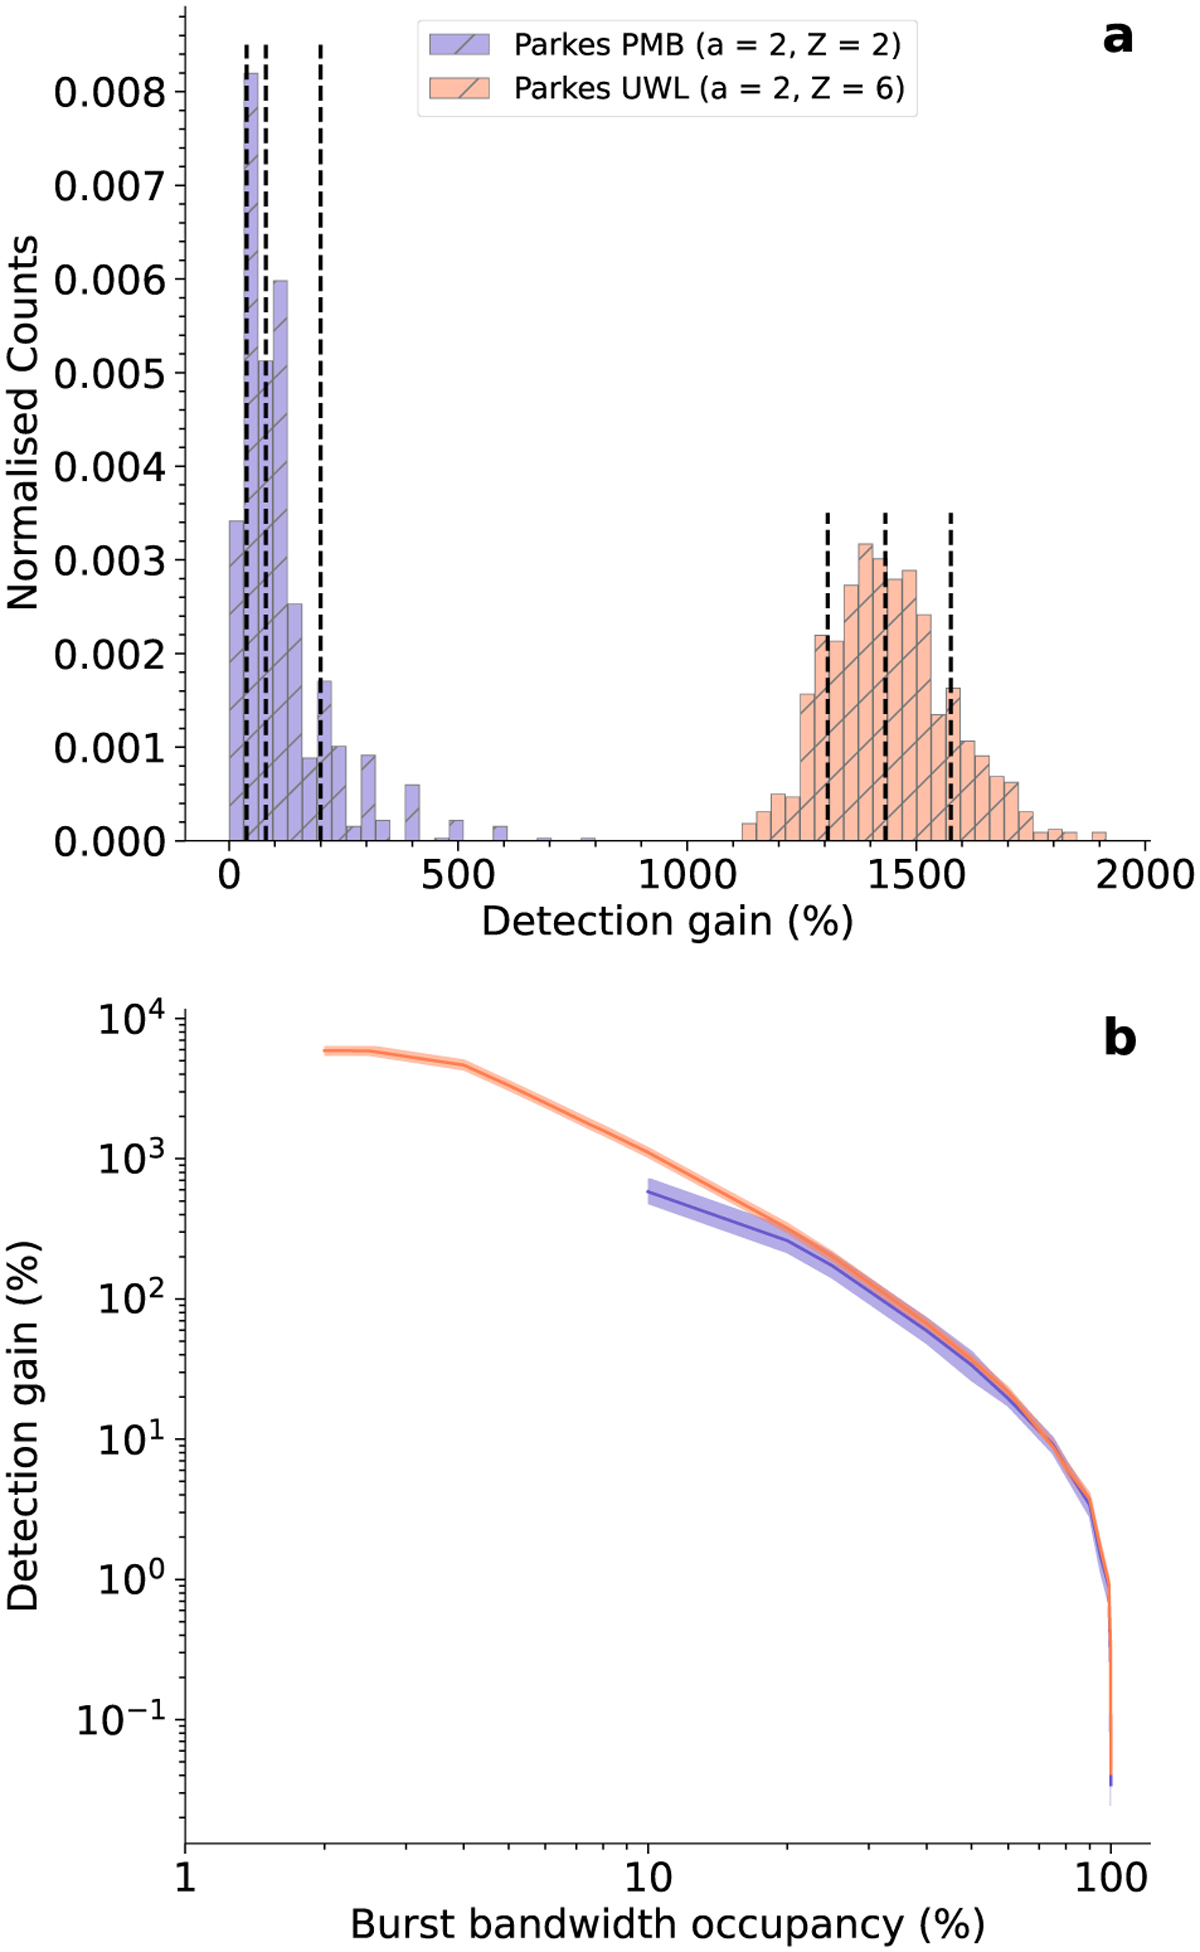
Results of the Monte Carlo experiments (see Sect. 2.2 for more details). The top panel a displays the distribution of the detection gain obtained by performing a sub-banded search over a full-band search (Experiment 1), both for the PMB (violet, search parameters a = 2 and Z = 2) and UWL (coral, search parameters a = 2, Z = 6) receivers. The dashed vertical lines represent the distribution percentiles at 16, 50, and 84%. The bottom panel b illustrates the sub-banded search detection gain as a function of the burst bandwidth occupancy (Experiment 2). The colour code and the sub-banded search parameters are the same as the top panel.
Current usage metrics show cumulative count of Article Views (full-text article views including HTML views, PDF and ePub downloads, according to the available data) and Abstracts Views on Vision4Press platform.
Data correspond to usage on the plateform after 2015. The current usage metrics is available 48-96 hours after online publication and is updated daily on week days.
Initial download of the metrics may take a while.