Fig. 6.
Download original image
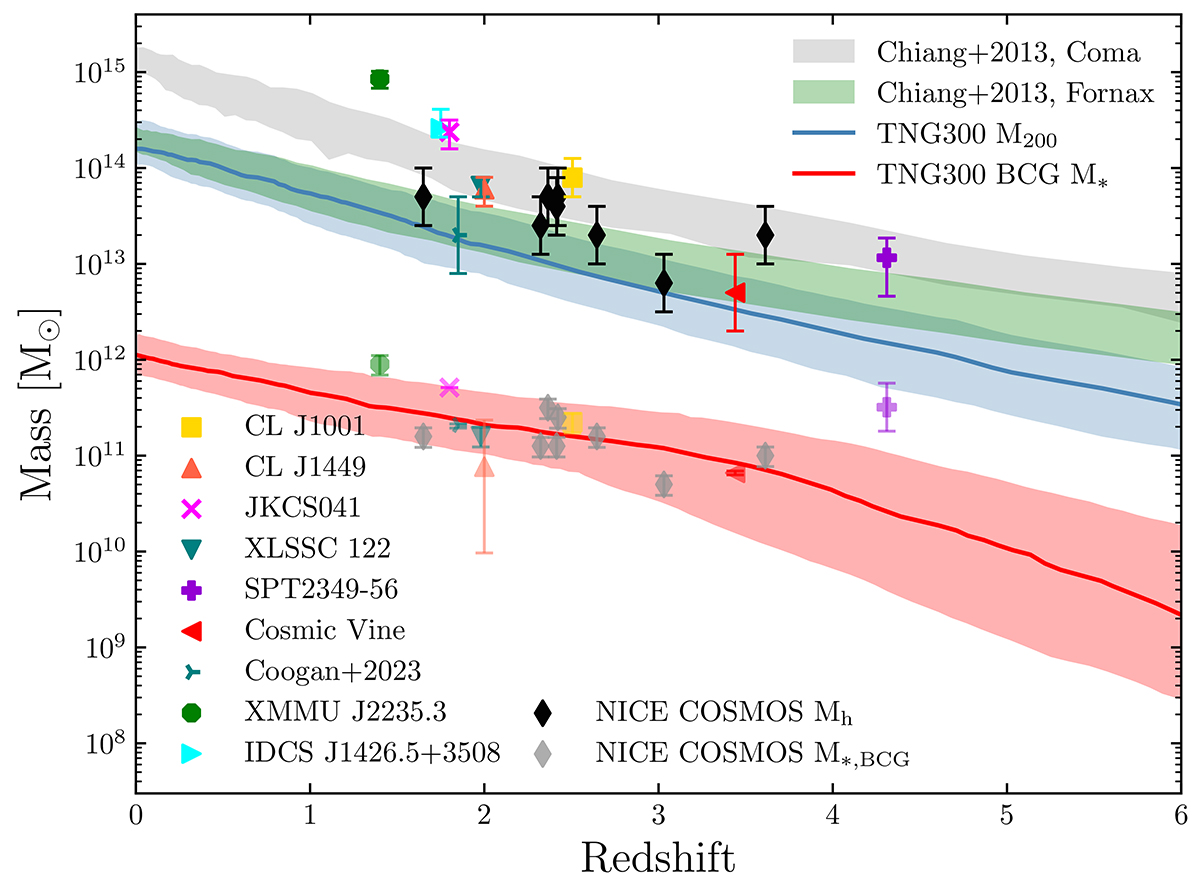
Dark matter halo mass (upper black points) and stellar mass of BCG (lower grey points) versus redshift. Overlaid are the halo mass of simulated progenitors of Fornax- and Coma-type clusters from Chiang et al. (2013) and halo and BCG masses from the TNG300 simulation (Montenegro-Taborda et al. 2023). The black and grey diamonds show halo masses and (proto-)BCG stellar masses from the NICE COSMOS sample. Other points show halo and (proto-)BCG masses from literature (proto-)clusters as identified in the figure (Jee et al. 2009; Rosati et al. 2009; Brodwin et al. 2016; Newman et al. 2014; Trudeau et al. 2022; Gobat et al. 2019; Strazzullo et al. 2018; Wang et al. 2016; Miller et al. 2018; Rotermund et al. 2021; Coogan et al. 2023).
Current usage metrics show cumulative count of Article Views (full-text article views including HTML views, PDF and ePub downloads, according to the available data) and Abstracts Views on Vision4Press platform.
Data correspond to usage on the plateform after 2015. The current usage metrics is available 48-96 hours after online publication and is updated daily on week days.
Initial download of the metrics may take a while.