Fig. D.1.
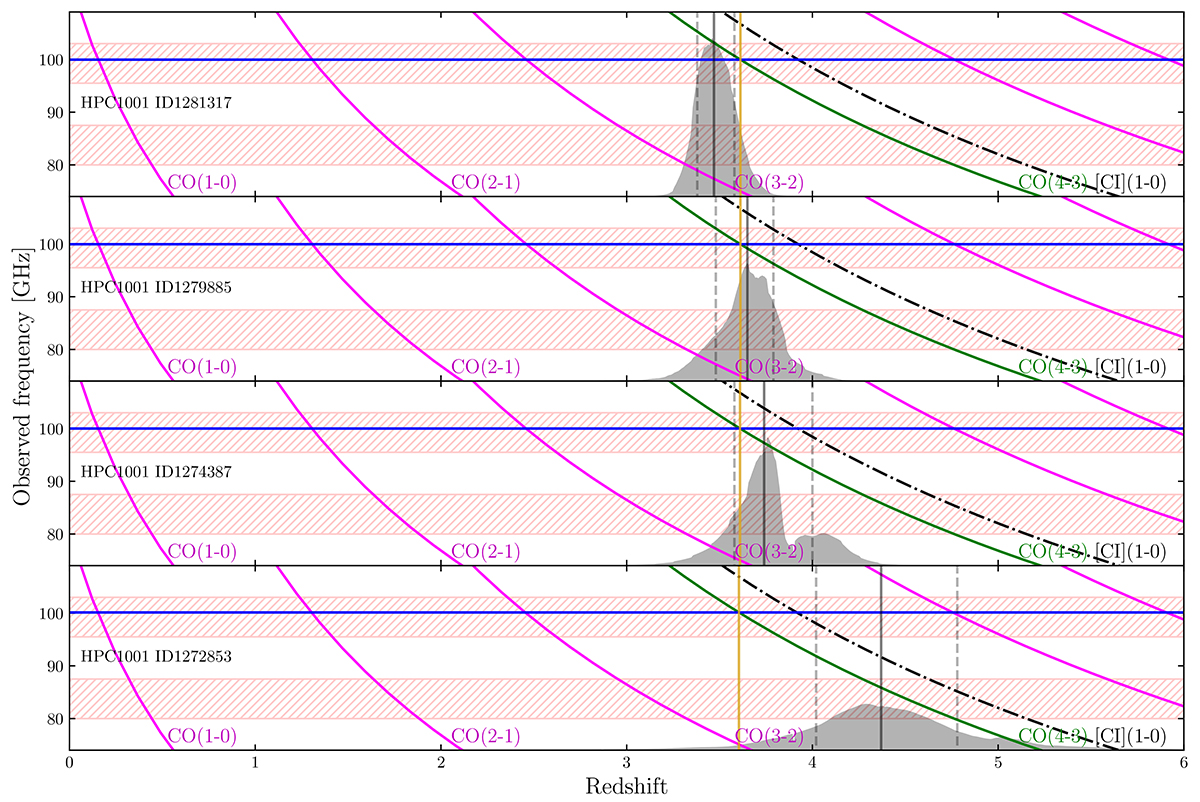
Download original image
Line identification for sources in the HPC1001 pointing. For each source we show the PDF(z) from COSMOS2020 Classic LePhare as a grey shaded area, and mark its 16th, 50th, and 84th percentile with vertical grey lines. The red shaded areas show the spectral coverage of the observations. Dot-dashed magenta and black curves show the observed frequencies of CO and CI lines as a function of redshift. The blue line marks the observed frequency of the detected line. We highlight the best redshift solution, zspec, with a vertical golden line. The identified emission lines are highlighted in green.
Current usage metrics show cumulative count of Article Views (full-text article views including HTML views, PDF and ePub downloads, according to the available data) and Abstracts Views on Vision4Press platform.
Data correspond to usage on the plateform after 2015. The current usage metrics is available 48-96 hours after online publication and is updated daily on week days.
Initial download of the metrics may take a while.