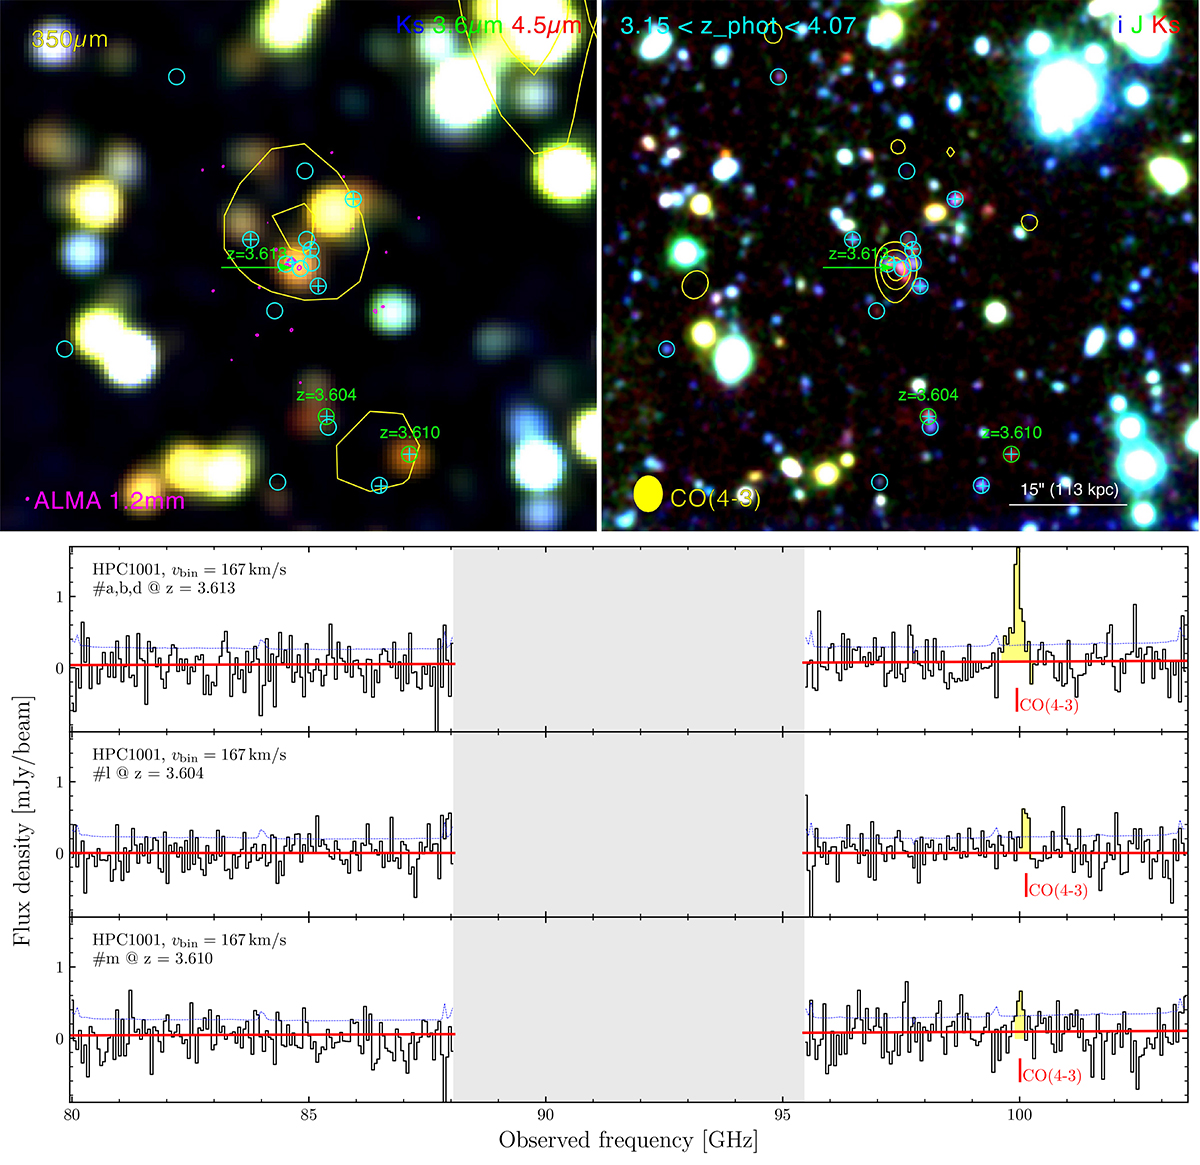
Fig. 1.
Download original image
Colour images and NOEMA spectra of HPC1001. Photometrically selected galaxies with 3.15 < zphot < 4.07 are shown in cyan circles. Spectroscopically confirmed galaxies are shown in green circles, with the spec-z labelled. Cyan plus signs indicate where 1D 3 mm spectra have been extracted. Top left: red-green-blue image corresponding to IRAC/4.5 and 3.6 μm, and UVISTA/Ks overlaid with yellow SPIRE/350 μm contours at 10, 20, and 30 mJy levels. Magenta contours show ALMA Band 6 1.2 mm dust continuum at 3, 5, and 7σ levels. Top right: red-green-blue image corresponding to UVISTA/Ks, J, and ACS/i. The yellow contours show CO(J = 4 − 3) line emission at 3, 5, and 7 σ levels. Bottom: NOEMA Band 1 spectra in the HPC1001 core. The continuum level is marked with a red line, and significant (Pchance < 5%) emission lines are marked in yellow. The dotted blue line shows the flux uncertainty (1σ) per channel. The structure name, bin velocity width, ID, and redshift are provided. Corresponding plots for the seven other fields are shown in Figs. A.1–A.7.
Current usage metrics show cumulative count of Article Views (full-text article views including HTML views, PDF and ePub downloads, according to the available data) and Abstracts Views on Vision4Press platform.
Data correspond to usage on the plateform after 2015. The current usage metrics is available 48-96 hours after online publication and is updated daily on week days.
Initial download of the metrics may take a while.