Fig. 5.
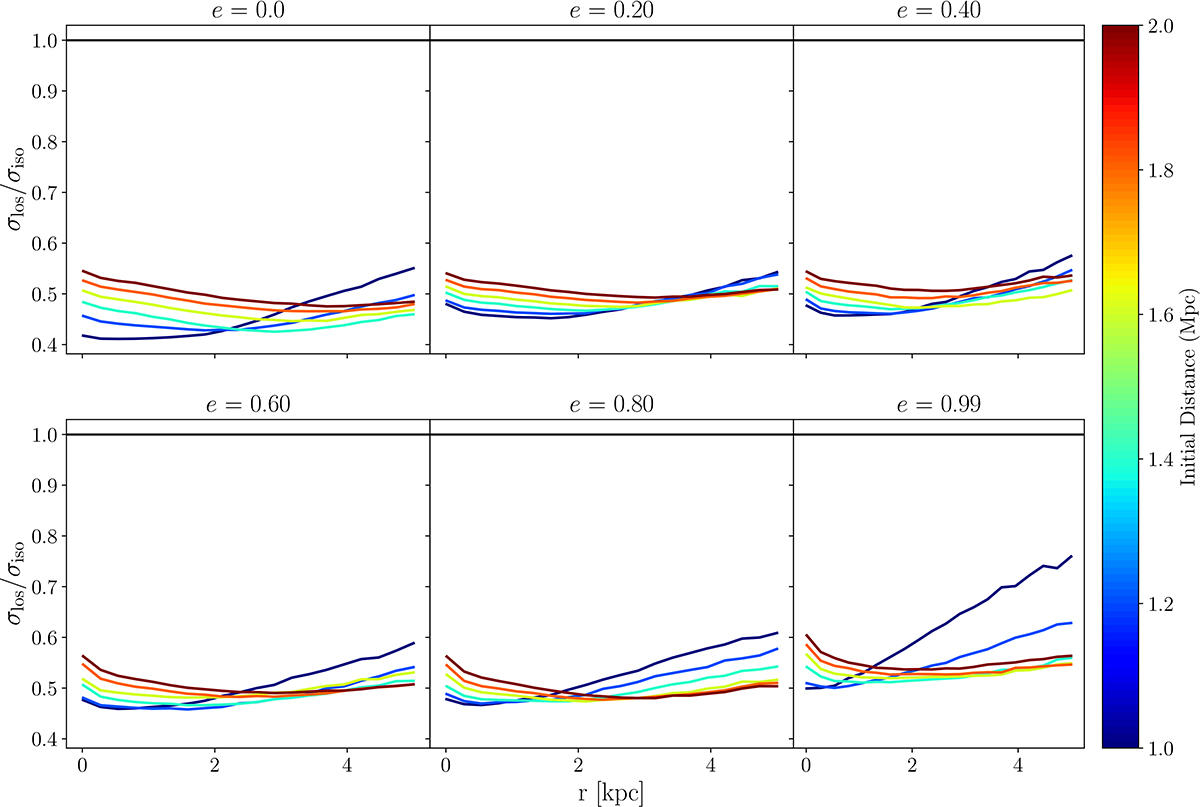
Download original image
Ratio between the line-of-sight velocity dispersion (σlos) of the simulated UDGs at apocentre and the corresponding expected isolated MOND prediction (σiso) as a function of radius. The six panels are arranged in the order of increasing eccentricity of the orbits of the launched UDGs, and the six different curves are colored based on the initial launch distance of the UDGs. The horizontal black line corresponds to σlos = σiso. The stellar velocity dispersion of observed Coma cluster UDGs are generally within 30% of σlos given their uncertainties (cf. Table 1 and Fig. 4 of Freundlich et al. 2022), a regime that no simulated UDG reaches.
Current usage metrics show cumulative count of Article Views (full-text article views including HTML views, PDF and ePub downloads, according to the available data) and Abstracts Views on Vision4Press platform.
Data correspond to usage on the plateform after 2015. The current usage metrics is available 48-96 hours after online publication and is updated daily on week days.
Initial download of the metrics may take a while.