Open Access
Fig. 2.
Download original image
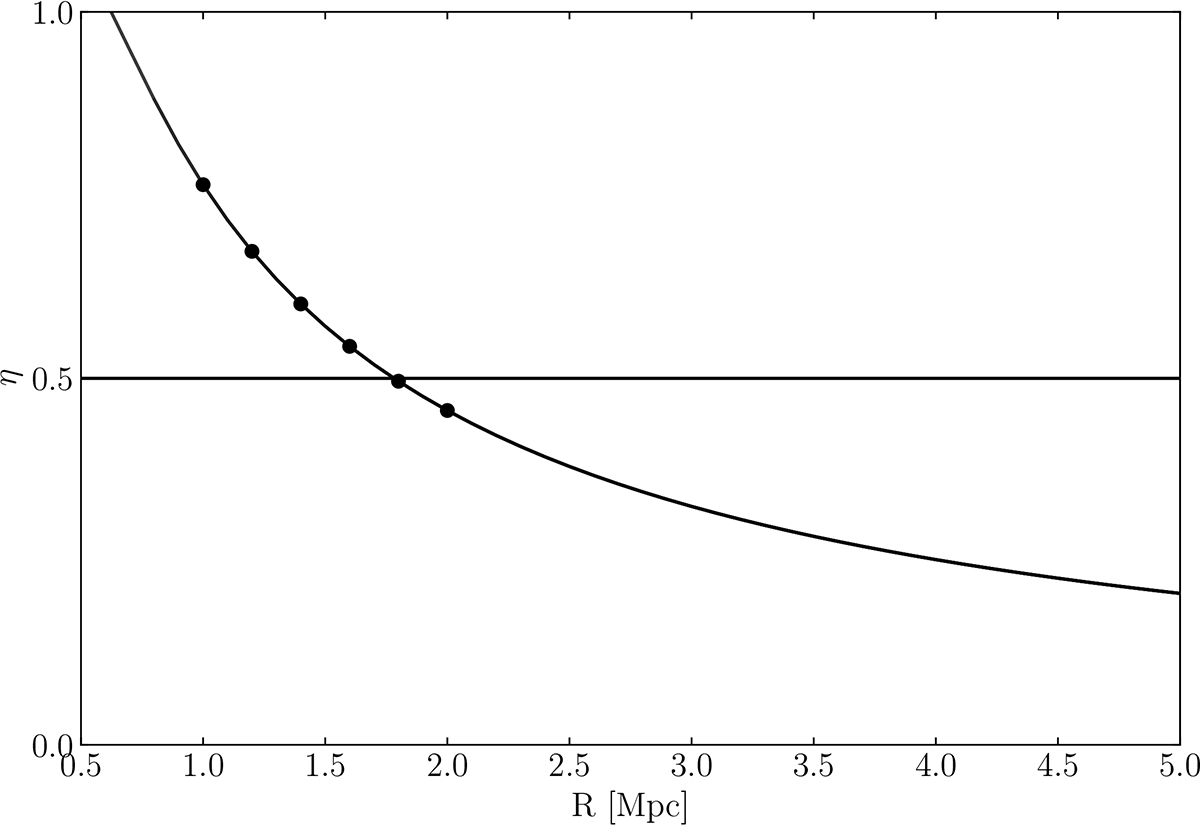
Tidal susceptibility, η, derived from Eq. (2) as a function of distance from the cluster centre. The solid black points mark the tidal susceptibility at the distances where the UDGs were launched. Points above the horizontal η = 0.5 line are expected to be at least partially affected by tides.
Current usage metrics show cumulative count of Article Views (full-text article views including HTML views, PDF and ePub downloads, according to the available data) and Abstracts Views on Vision4Press platform.
Data correspond to usage on the plateform after 2015. The current usage metrics is available 48-96 hours after online publication and is updated daily on week days.
Initial download of the metrics may take a while.