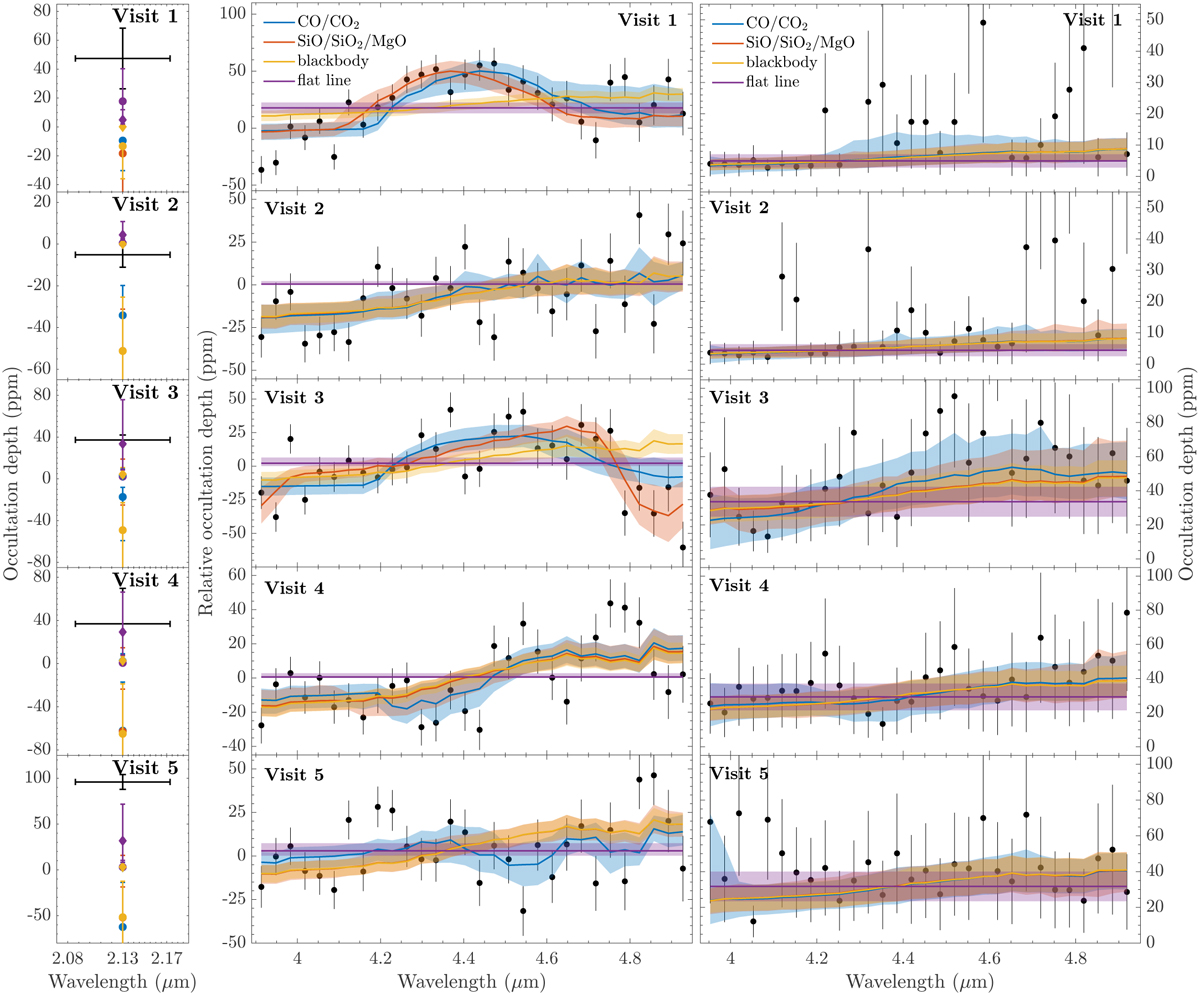
Fig. 3
Download original image
Posterior spectra for all model scenarios and visits. The left column shows predicted occultation depths in the shortwave channel. The black data points indicate the observed value, while diamonds represent the retrieval results for the HANSOLO reduction and squares refer to the outcome for the stark. The vertical error bars represent the 1-σ confidence intervals. The middle column shows the posterior spectra for stark, while the column on the right-hand side displays the corresponding results for HANSOLO. Solid lines refer to the median spectra from the posterior sample, while the shaded areas correspond to the 1-σ intervals. We note that the retrievals for the stark reductions were made for relative occultation depths, i.e. the mean occultation depths in the middle column are close to zero.
Current usage metrics show cumulative count of Article Views (full-text article views including HTML views, PDF and ePub downloads, according to the available data) and Abstracts Views on Vision4Press platform.
Data correspond to usage on the plateform after 2015. The current usage metrics is available 48-96 hours after online publication and is updated daily on week days.
Initial download of the metrics may take a while.