Fig. 8.
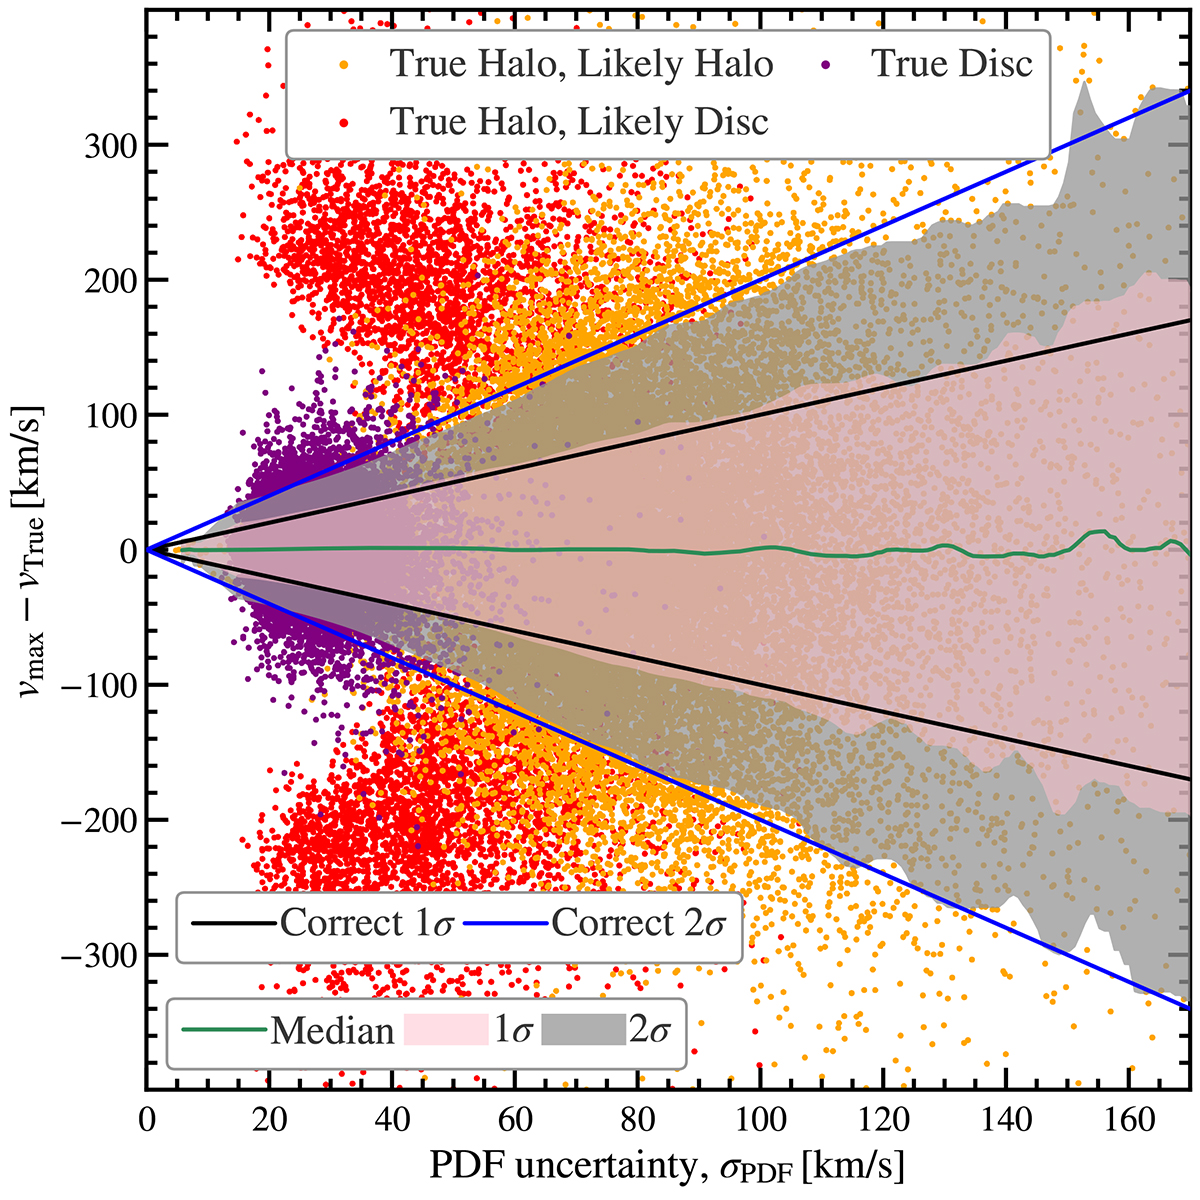
Download original image
Uncertainty in our predicted vlos PDFs against the difference between the true value vTrue and our predicted line-of-sight velocity vmax. True Disc stars are plotted in purple, downsampled by a factor of 1000, the true Halo stars that are determined to be likely Halo stars by our method (probability greater than 80%) in orange, and true Halo stars that are misdetermined to be likely disc stars in red, both downsampled by a factor of 2. The median line and shaded regions indicate the binned running median and 1σ and 2σ values of the total distribution, defined from the 16%−84% range. If the predictions are unbiased and the predicted PDF uncertainties accurate, the binned 1σ and 2σ values regions are expected to follow the value of their own corresponding bin, plotted in solid black and blue lines.
Current usage metrics show cumulative count of Article Views (full-text article views including HTML views, PDF and ePub downloads, according to the available data) and Abstracts Views on Vision4Press platform.
Data correspond to usage on the plateform after 2015. The current usage metrics is available 48-96 hours after online publication and is updated daily on week days.
Initial download of the metrics may take a while.