Fig. 7.
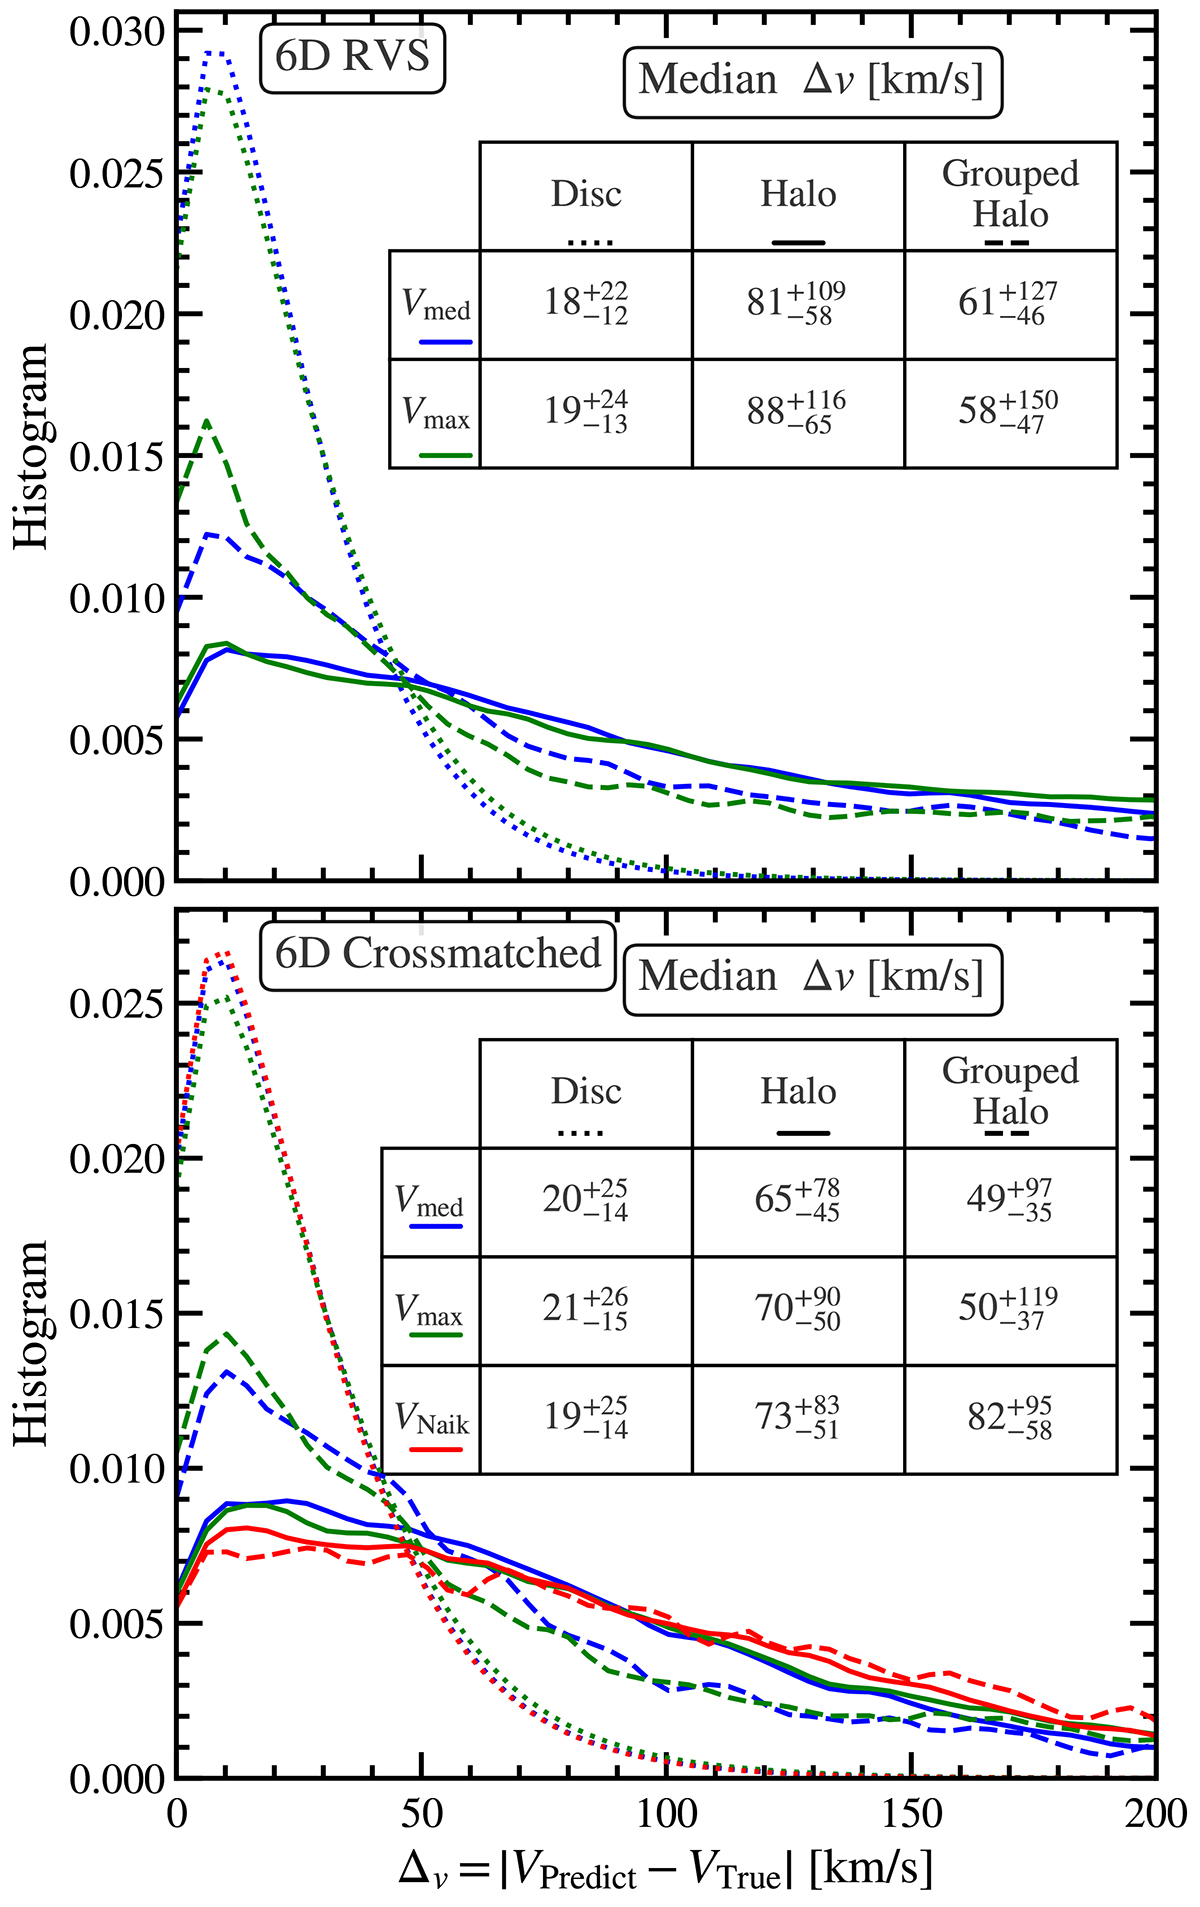
Download original image
Distributions of the difference between vlos predictions and the true vlos across different subsamples of the Disc, the total Halo, and the stars belonging to substructure in the Halo. The top panel sample is from the Gaia RVS catalogue and includes vlos estimates our PDF’s the median and peak maximum values. The bottom panel shows a sample of stars from surveys crossmatched with Gaia and includes vlos estimates from Naik24. The tables contain the median velocity error for the different velocity predictions across the different subsamples.
Current usage metrics show cumulative count of Article Views (full-text article views including HTML views, PDF and ePub downloads, according to the available data) and Abstracts Views on Vision4Press platform.
Data correspond to usage on the plateform after 2015. The current usage metrics is available 48-96 hours after online publication and is updated daily on week days.
Initial download of the metrics may take a while.