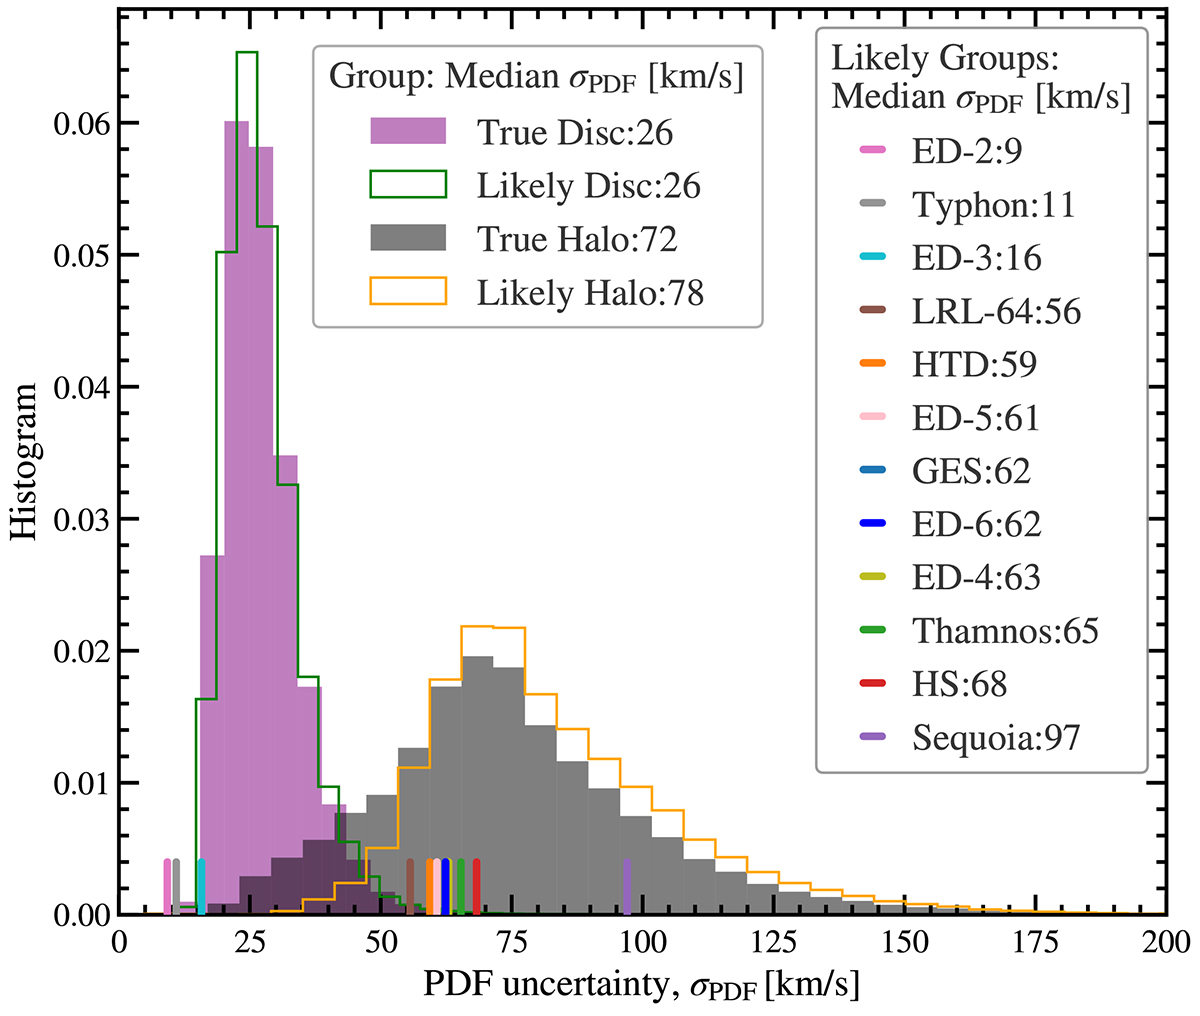
Fig. 6.
Download original image
Distributions of σPDF (defined as half the 84%−16% vlos values) of the PDFs predicted by our method. The sample is split into Halo and Disc stars, whose normalised histograms of the true decomposition are plotted with solid-filled colours. The likely decomposition, defined by the probability of membership greater than 80%, is plotted with lines. The median values for the distributions for stars belonging to different groups (based on Dodd23) are shown in different colours.
Current usage metrics show cumulative count of Article Views (full-text article views including HTML views, PDF and ePub downloads, according to the available data) and Abstracts Views on Vision4Press platform.
Data correspond to usage on the plateform after 2015. The current usage metrics is available 48-96 hours after online publication and is updated daily on week days.
Initial download of the metrics may take a while.