Fig. D.1.
Download original image
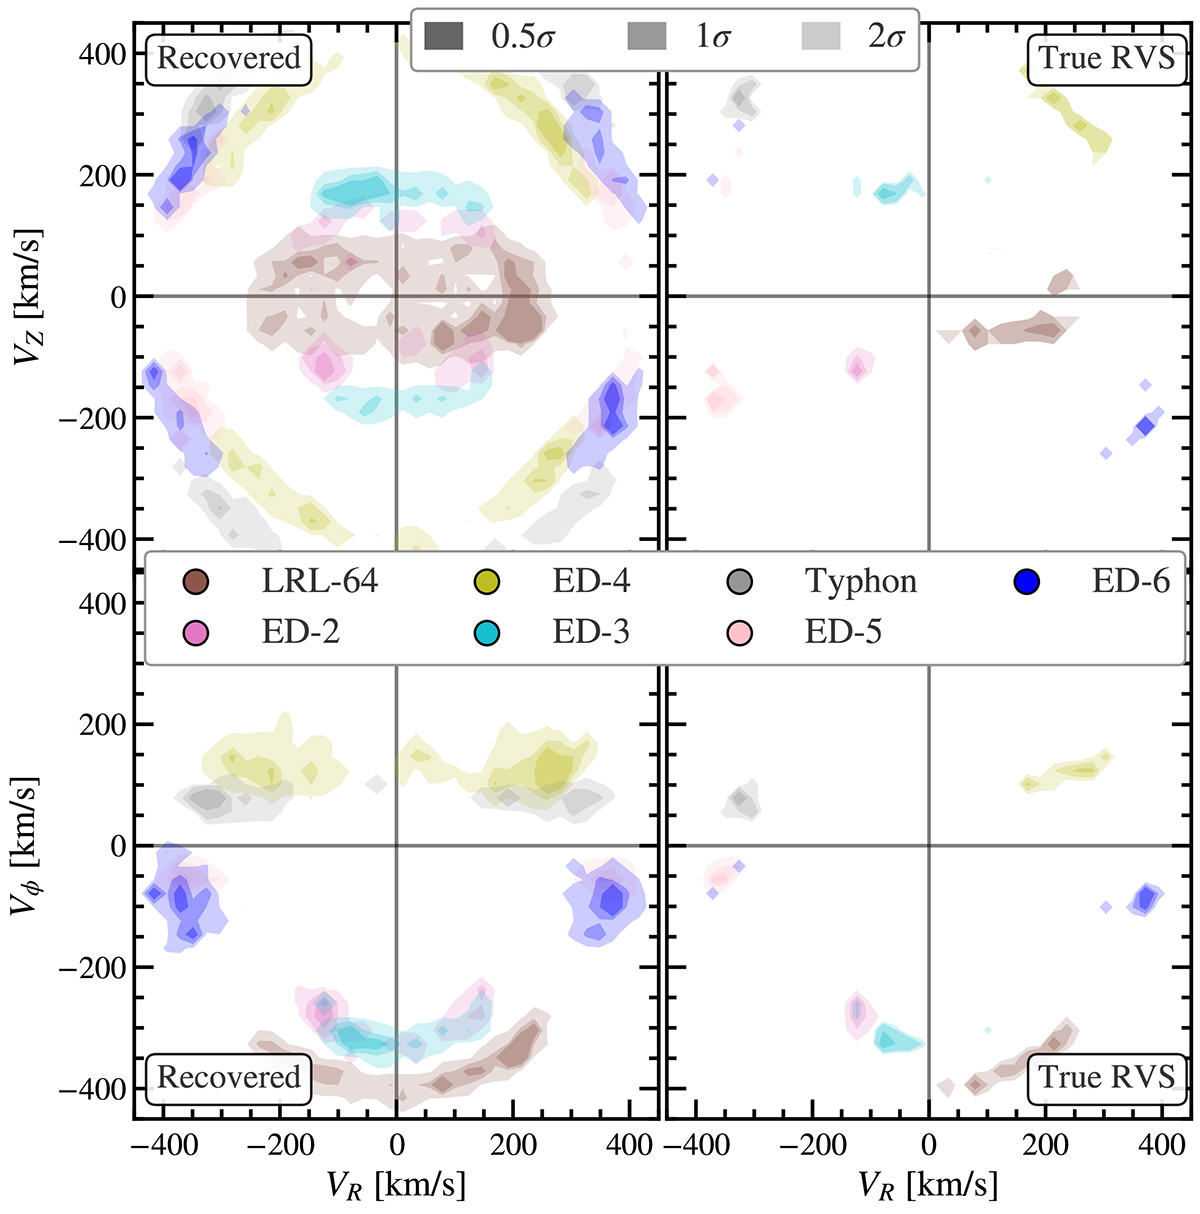
Cylindrical velocity distributions of the different stellar Halo groups, as recovered by our methodology (lefthand side), against the true distributions (righthand side). Different groups are represented using different colours, with the opacity of the colours indicating (0.5σ,1σ,2σ) levels (equivalently 38%,64%,95%). This figure is a comparison to Fig. 10, where the phase-clumped nature of the selected groups are additionally modelled with an additional step. Here are the results of assuming all groups are perfectly phase-mixed, resulting in near-symmetric velocity distributions in the radial and vertical components.
Current usage metrics show cumulative count of Article Views (full-text article views including HTML views, PDF and ePub downloads, according to the available data) and Abstracts Views on Vision4Press platform.
Data correspond to usage on the plateform after 2015. The current usage metrics is available 48-96 hours after online publication and is updated daily on week days.
Initial download of the metrics may take a while.