Fig. 15.
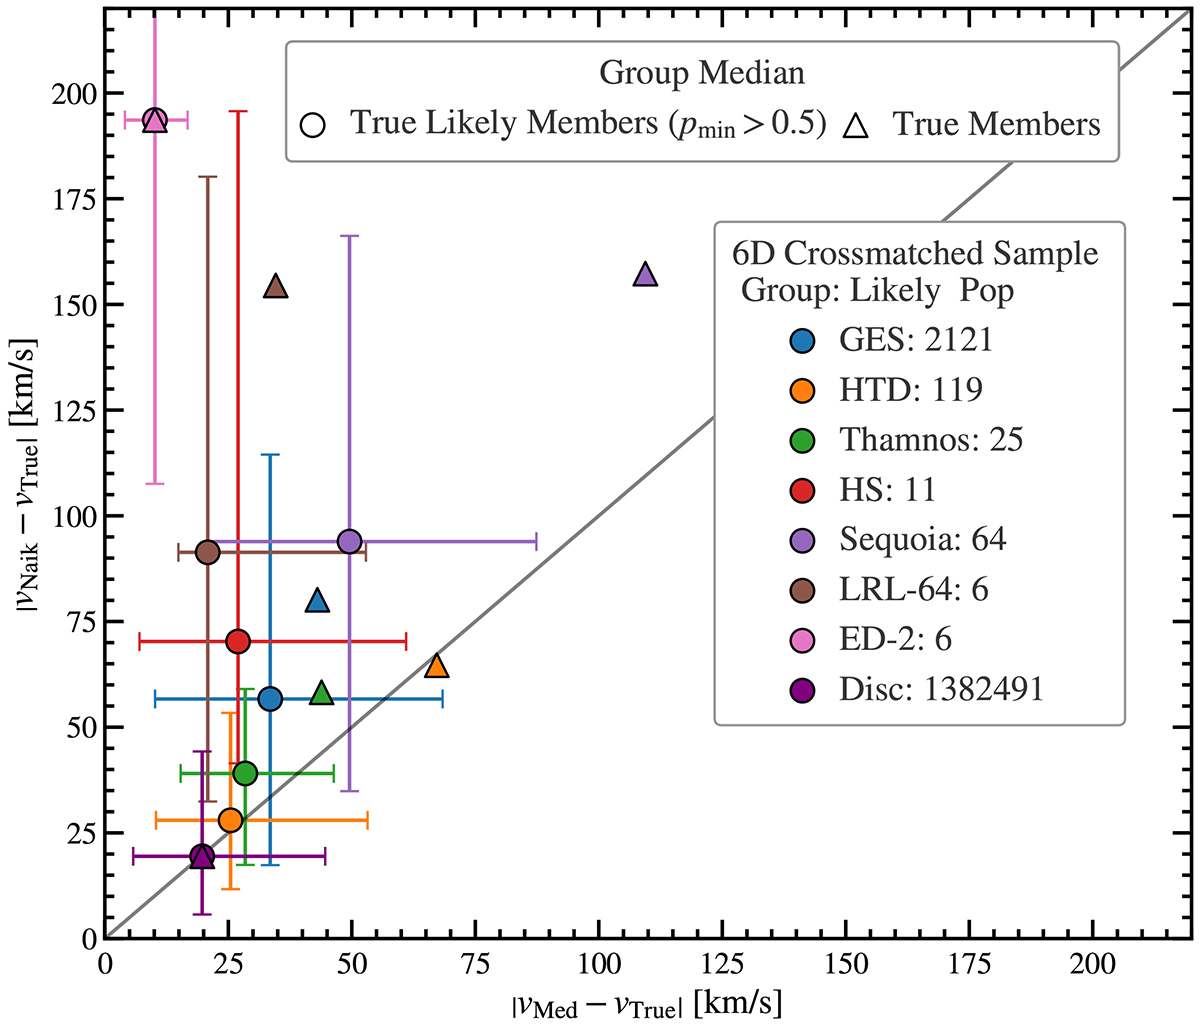
Download original image
Comparisons between the differences between the true vlos and the predictions of our methodology and Naik24, with samples decomposed into different halo substructures. We include all stars from the true groups, plotted with triangles, and true likely members with membership probability greater than 50%. Only groups with more than 4 likely members are plotted. The points and error bars represent the median and the 16% and 84% percentiles of the distribution, respectively, for the likely groups. These results use the crossmatched 6D sample described in the main text.
Current usage metrics show cumulative count of Article Views (full-text article views including HTML views, PDF and ePub downloads, according to the available data) and Abstracts Views on Vision4Press platform.
Data correspond to usage on the plateform after 2015. The current usage metrics is available 48-96 hours after online publication and is updated daily on week days.
Initial download of the metrics may take a while.