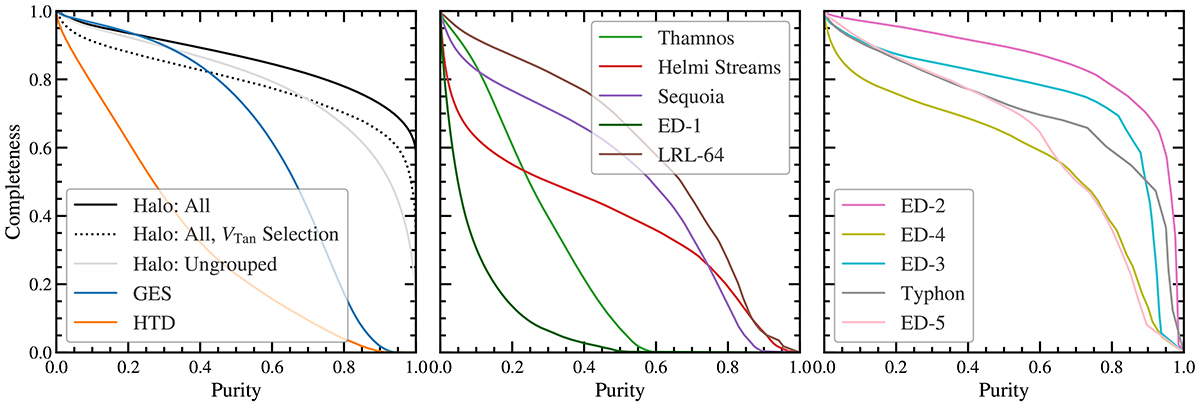
Fig. 14.
Download original image
Curves describing the effective recovery for our different groupings, using the expected purity and completeness of a given probability cutoff. These curves describe the inherent trade-off of choosing a sample of stars; the higher the purity, the lower the completeness. Better recovered structures have a higher completeness for a given purity. In the first panel, we additionally plot the recovery curve from making a transverse sky velocity cut (see text for details).
Current usage metrics show cumulative count of Article Views (full-text article views including HTML views, PDF and ePub downloads, according to the available data) and Abstracts Views on Vision4Press platform.
Data correspond to usage on the plateform after 2015. The current usage metrics is available 48-96 hours after online publication and is updated daily on week days.
Initial download of the metrics may take a while.