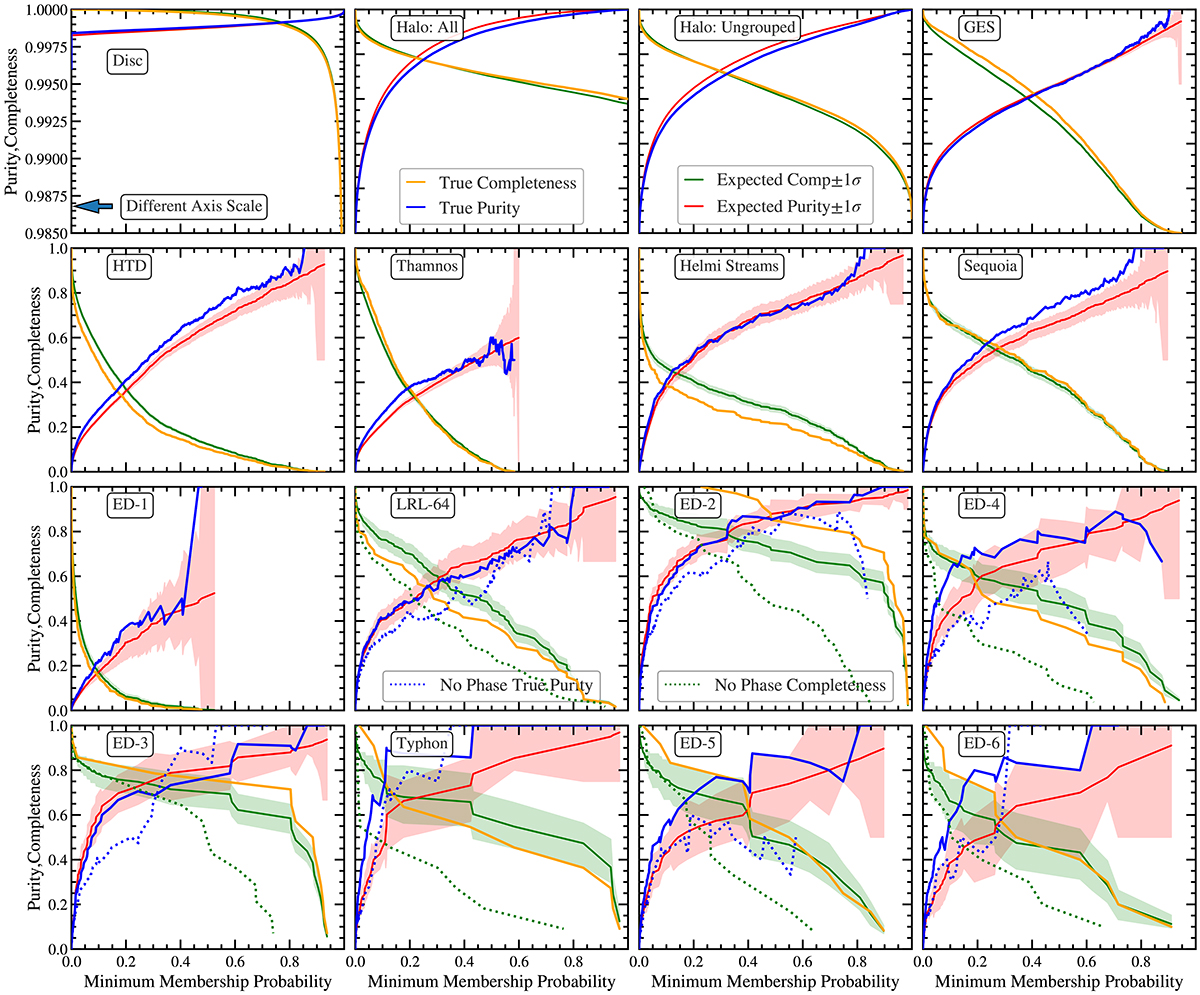
Fig. 13.
Download original image
Plots depicting effects of increasing the minimum membership probability upon the purity and completeness of the selected sample of a group. For each group (panel), increasing the probability cut on membership probability (x-axis) increases the purity of the selected group, but decreases the completeness (y-axis). We plot the true purity and completeness, and the expected purity and completeness calculated from the probability distribution. For groups that show evidence of being phase-clumped, we also plot the purity and completeness calculated without the additional phase considerations (see Sect. 4.2).
Current usage metrics show cumulative count of Article Views (full-text article views including HTML views, PDF and ePub downloads, according to the available data) and Abstracts Views on Vision4Press platform.
Data correspond to usage on the plateform after 2015. The current usage metrics is available 48-96 hours after online publication and is updated daily on week days.
Initial download of the metrics may take a while.