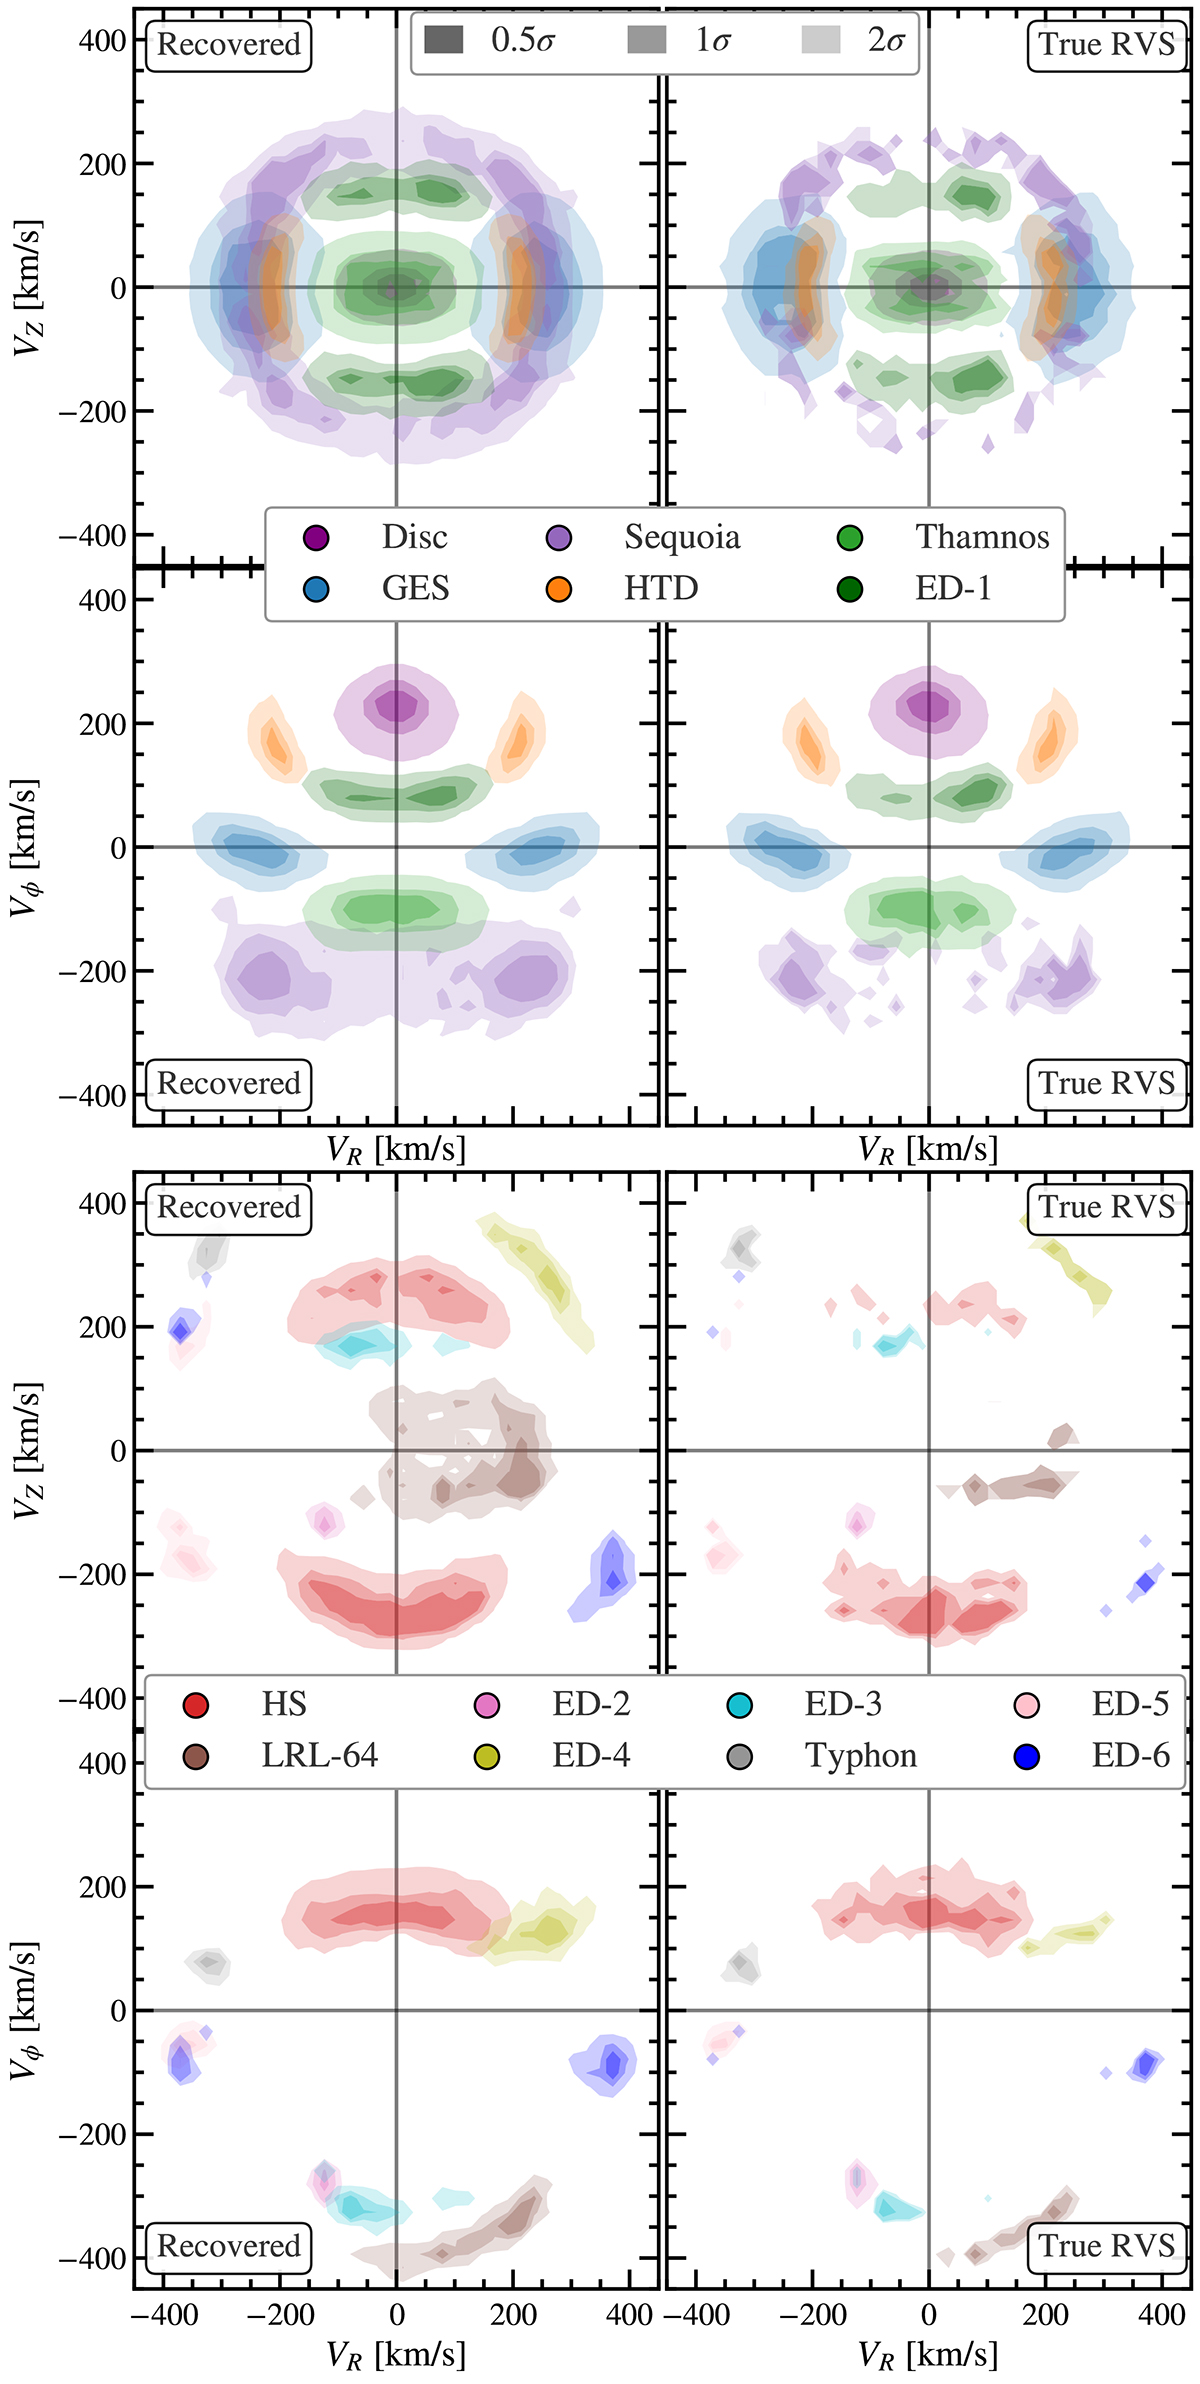
Fig. 10.
Download original image
Cylindrical velocity distributions of the different groups, as recovered by our methodology (lefthand side) against the true distributions (righthand side). Different stellar groups are represented by different colours, with the opacity of the colour representing the (0.5σ, 1σ, 2σ) levels (equivalently the 38%, 64%, and 95% regions). The groups are split into two separate subpanels, with the majority of phase-mixed groups in the top set and phase-clumped groups, with the addition of the Helmi Streams to allow the groups to be visually distinguished, in the bottom set.
Current usage metrics show cumulative count of Article Views (full-text article views including HTML views, PDF and ePub downloads, according to the available data) and Abstracts Views on Vision4Press platform.
Data correspond to usage on the plateform after 2015. The current usage metrics is available 48-96 hours after online publication and is updated daily on week days.
Initial download of the metrics may take a while.