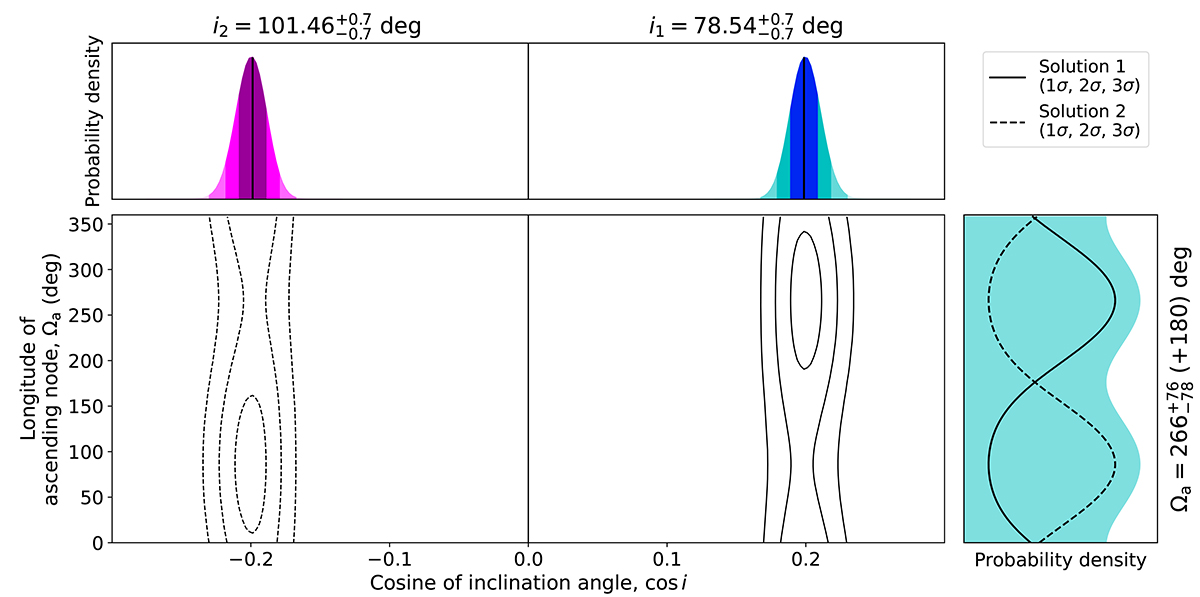
Fig. 6.
Download original image
Constraints on the orbital orientation from the χ2 mapping of DDGR solutions consistent with Eq. (11). The constraints have been derived in the global fit and assuming the Cs noise model (Table 2) Central plots: two-dimensional constraints in the Ωa − cos i space. The solid contours represent the explored space (cos i > 0), while the dashed contours are derived from symmetries in eq. (11) (cos i < 0). Corner plots, top: marginalised one-dimensional probability densities for cos i, showcasing the median value (solid black lines) and the 31.4%, 47.4%, and 49.9% percentiles (shaded areas under the curve, blue for cos i > 0 and purple for cos i < 0). Corner plot, right: marginalised one-dimensional probability densities for Ωa from cos i > 0 and cos i < 0 (solid and dashed lines, respectively) and the addition of both (shaded cyan area).
Current usage metrics show cumulative count of Article Views (full-text article views including HTML views, PDF and ePub downloads, according to the available data) and Abstracts Views on Vision4Press platform.
Data correspond to usage on the plateform after 2015. The current usage metrics is available 48-96 hours after online publication and is updated daily on week days.
Initial download of the metrics may take a while.