Fig. 5.
Download original image
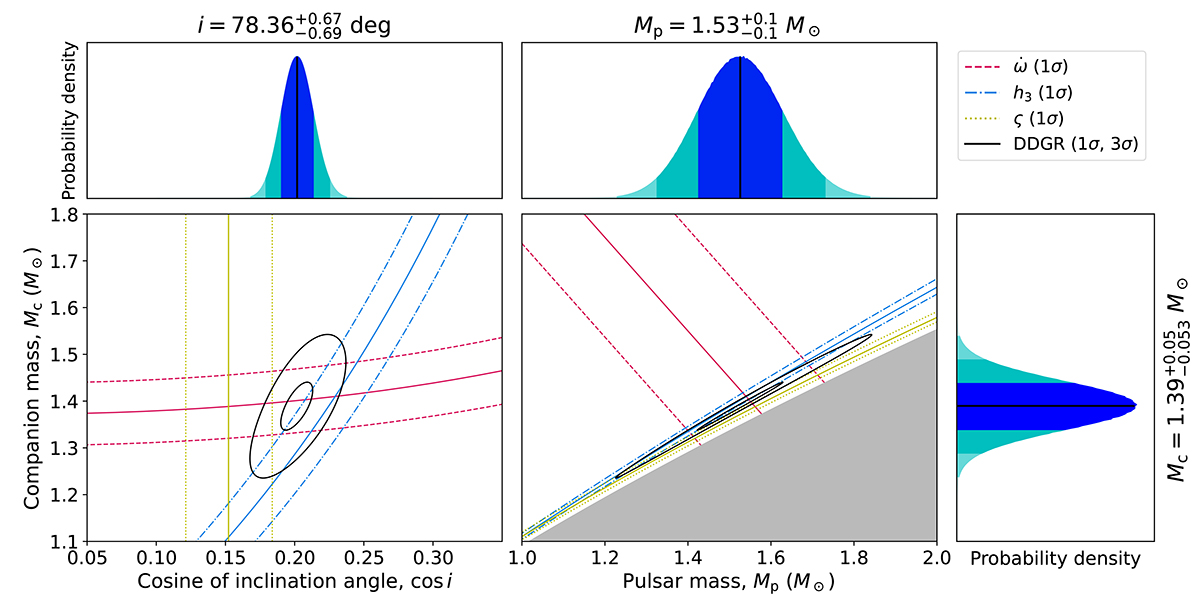
Mass and inclination angle constraints from the DDH PK measurements and the χ2 mapping with the DDGR model. The constraints have been derived in the global fit and under the assumption of the Cs noise model (Table 2). Central plots: two-dimensional constraints on the Mc − cos i and Mc − Mp spaces. The solid coloured lines represent the nominal values of the PK parameters, the dashed coloured lines their 1σ limits, and the solid black lines the 1σ and 3σ limits from DDGR. The shaded grey area in the right plot is the region excluded by the mass function (i > 90 deg). Corner plots: marginalised one-dimensional probability densities for Mp, Mc, and cos i from DDGR χ2 mapping, showcasing the median value (solid black line) and the 31.4%, 47.4%, and 49.9% percentiles on both sides (shaded areas under the curve).
Current usage metrics show cumulative count of Article Views (full-text article views including HTML views, PDF and ePub downloads, according to the available data) and Abstracts Views on Vision4Press platform.
Data correspond to usage on the plateform after 2015. The current usage metrics is available 48-96 hours after online publication and is updated daily on week days.
Initial download of the metrics may take a while.