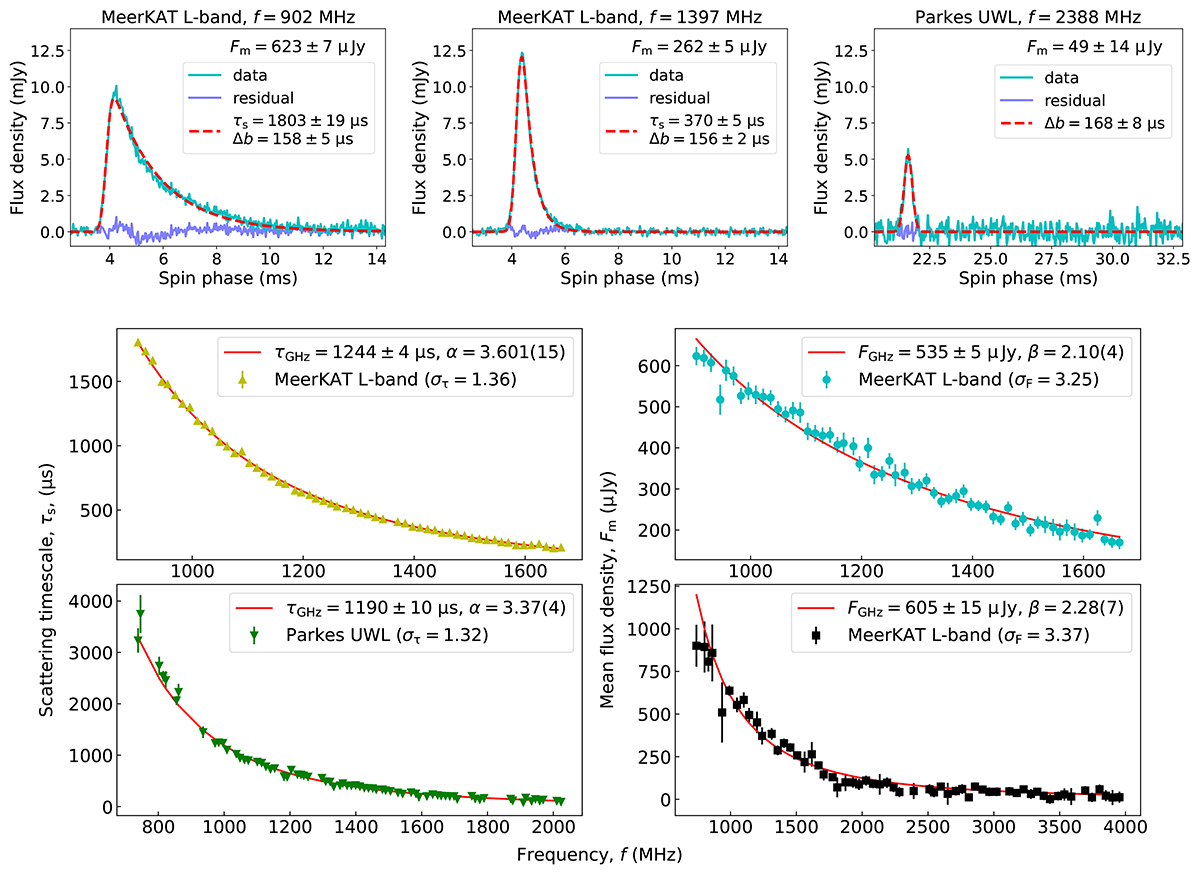
Fig. 2.

Download original image
Frequency evolution of the scattering and mean flux density, and their modelling. Top: pulse profiles of J1227−6208 at f = 902 MHz and f = 1397 MHz as is seen by the MeerKAT L-band receiver (left and middle plots), and at f = 2388 MHz as is seen by the Parkes UWL receiver (right plot). The data (cyan lines) is shown against the best model (red dashes, fitted with equation 1) and the fit residuals (blue lines). The fit parameters τs and Δb from equation (1), and the mean flux density Fm are quoted on each profile. Bottom: measurements of Δτ and Fm at each frequency on the MeerKAT L-band and Parkes UWL profiles (dots with uncertainties), and the best fits of the power laws (2) and (3) (red lines). The data points are displayed accounting for the error factors στ and σF, and the relevant τGHz, α, FGHz, and β values are quoted in the legend.
Current usage metrics show cumulative count of Article Views (full-text article views including HTML views, PDF and ePub downloads, according to the available data) and Abstracts Views on Vision4Press platform.
Data correspond to usage on the plateform after 2015. The current usage metrics is available 48-96 hours after online publication and is updated daily on week days.
Initial download of the metrics may take a while.


