Fig. 9
Download original image
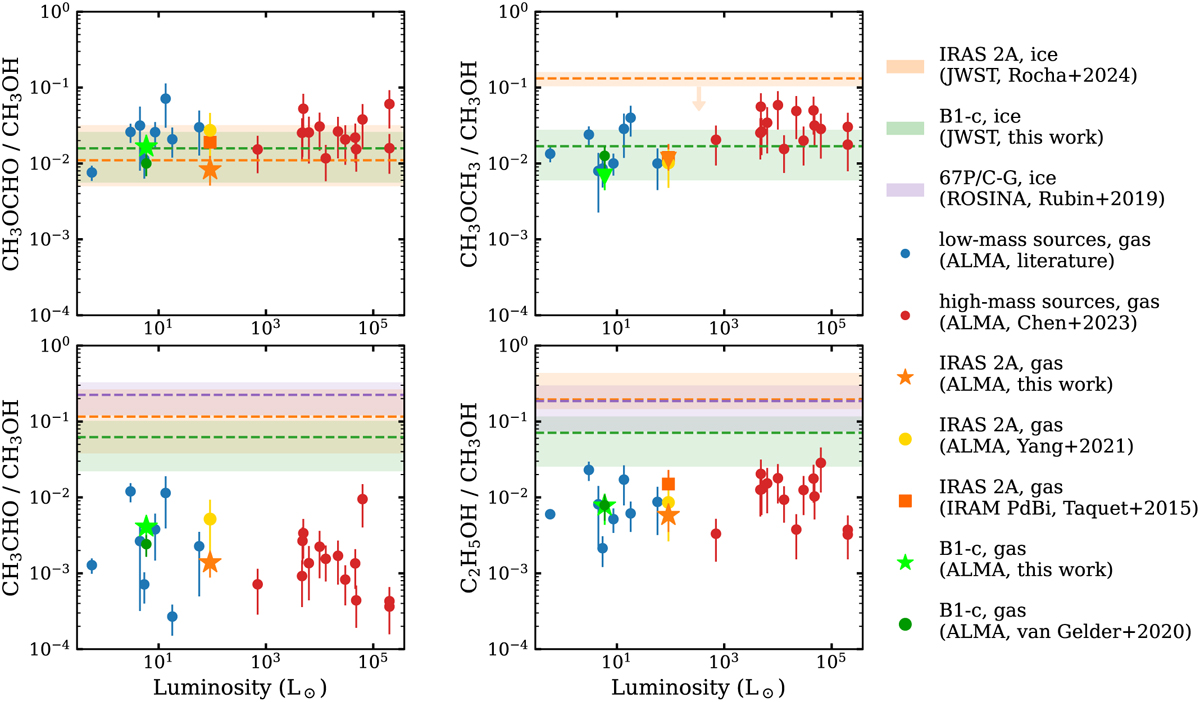
Ratios of four O-COMs with respect to CH3OH in gas (data points) and ice (shaded regions). Gas ratios are collected from a total sample of nine low-mass sources from this work and literature (blue circles; Jørgensen et al. 2018; Manigand et al. 2020; van Gelder et al. 2020; Yang et al. 2021), and 14 high-mass sources from the coccoa survey (Chen et al. 2023). Ice ratios are available for only two protostars (IRAS 2A and B1-c; Rocha et al. 2024, this work) and one comet (67P/C-G; Rubin et al. 2019). All data of the two focused low-mass sources, NGC 1333 IRAS 2A and B1-c, are colored in orange and green, respectively. The gas ratios of IRAS 2A and B1-c derived in this work and previous observations are highlighted in stars and squares (Taquet et al. 2015; van Gelder et al. 2020), respectively. Upper limits are denoted by downward triangles or arrows.
Current usage metrics show cumulative count of Article Views (full-text article views including HTML views, PDF and ePub downloads, according to the available data) and Abstracts Views on Vision4Press platform.
Data correspond to usage on the plateform after 2015. The current usage metrics is available 48-96 hours after online publication and is updated daily on week days.
Initial download of the metrics may take a while.