Fig. 7
Download original image
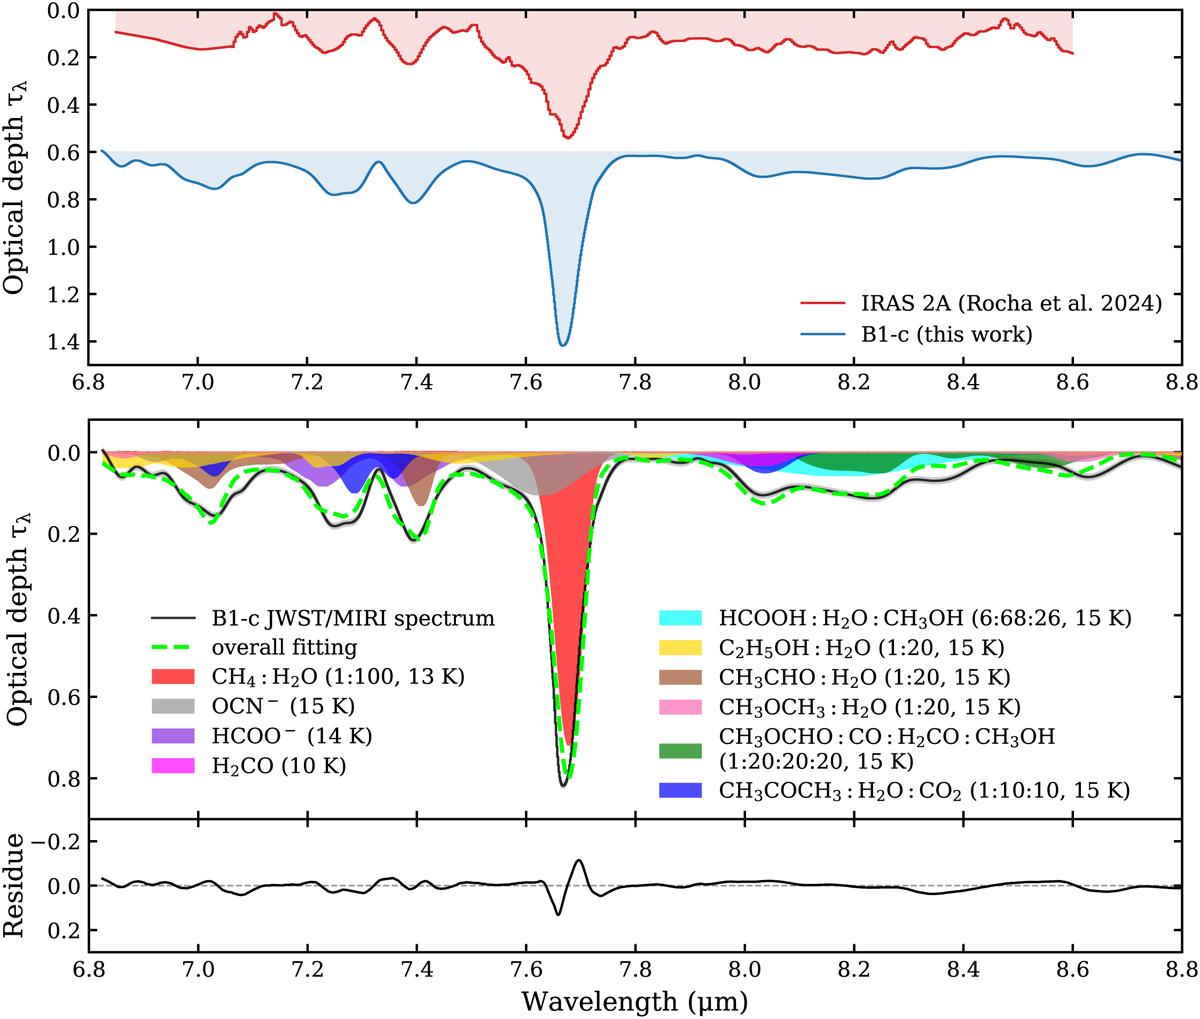
Isolated JWST/MIRI-MRS spectrum between 6.8 and 8.8 μm of IRAS 2A (Rocha et al. 2024) and B1-c (top panel), along with the best-fit decomposition of the B1-c spectrum (bottom panel). The IRAS 2A spectrum was binned by a factor of four, and therefore shows a lower spectral resolution. The B1-c spectrum is the version after removing the gas-phase lines (i.e., the black line in Fig. 3d). In the bottom panel, nine out of 12 candidate species that have statistically significant contribution to the 6.8–8.8 μm range are displayed, with the other three species (SO2, CH3COOH, and CH3CN) excluded. The best-fit mixing conditions (constituents, ratio, and temperature) selected in Sect. 3.2.5 are labeled in the legend. The residue is shown below. A step-by-step version of the best-fit results of the B1-c spectrum is given by Fig. K.11.
Current usage metrics show cumulative count of Article Views (full-text article views including HTML views, PDF and ePub downloads, according to the available data) and Abstracts Views on Vision4Press platform.
Data correspond to usage on the plateform after 2015. The current usage metrics is available 48-96 hours after online publication and is updated daily on week days.
Initial download of the metrics may take a while.