Fig. 4
Download original image
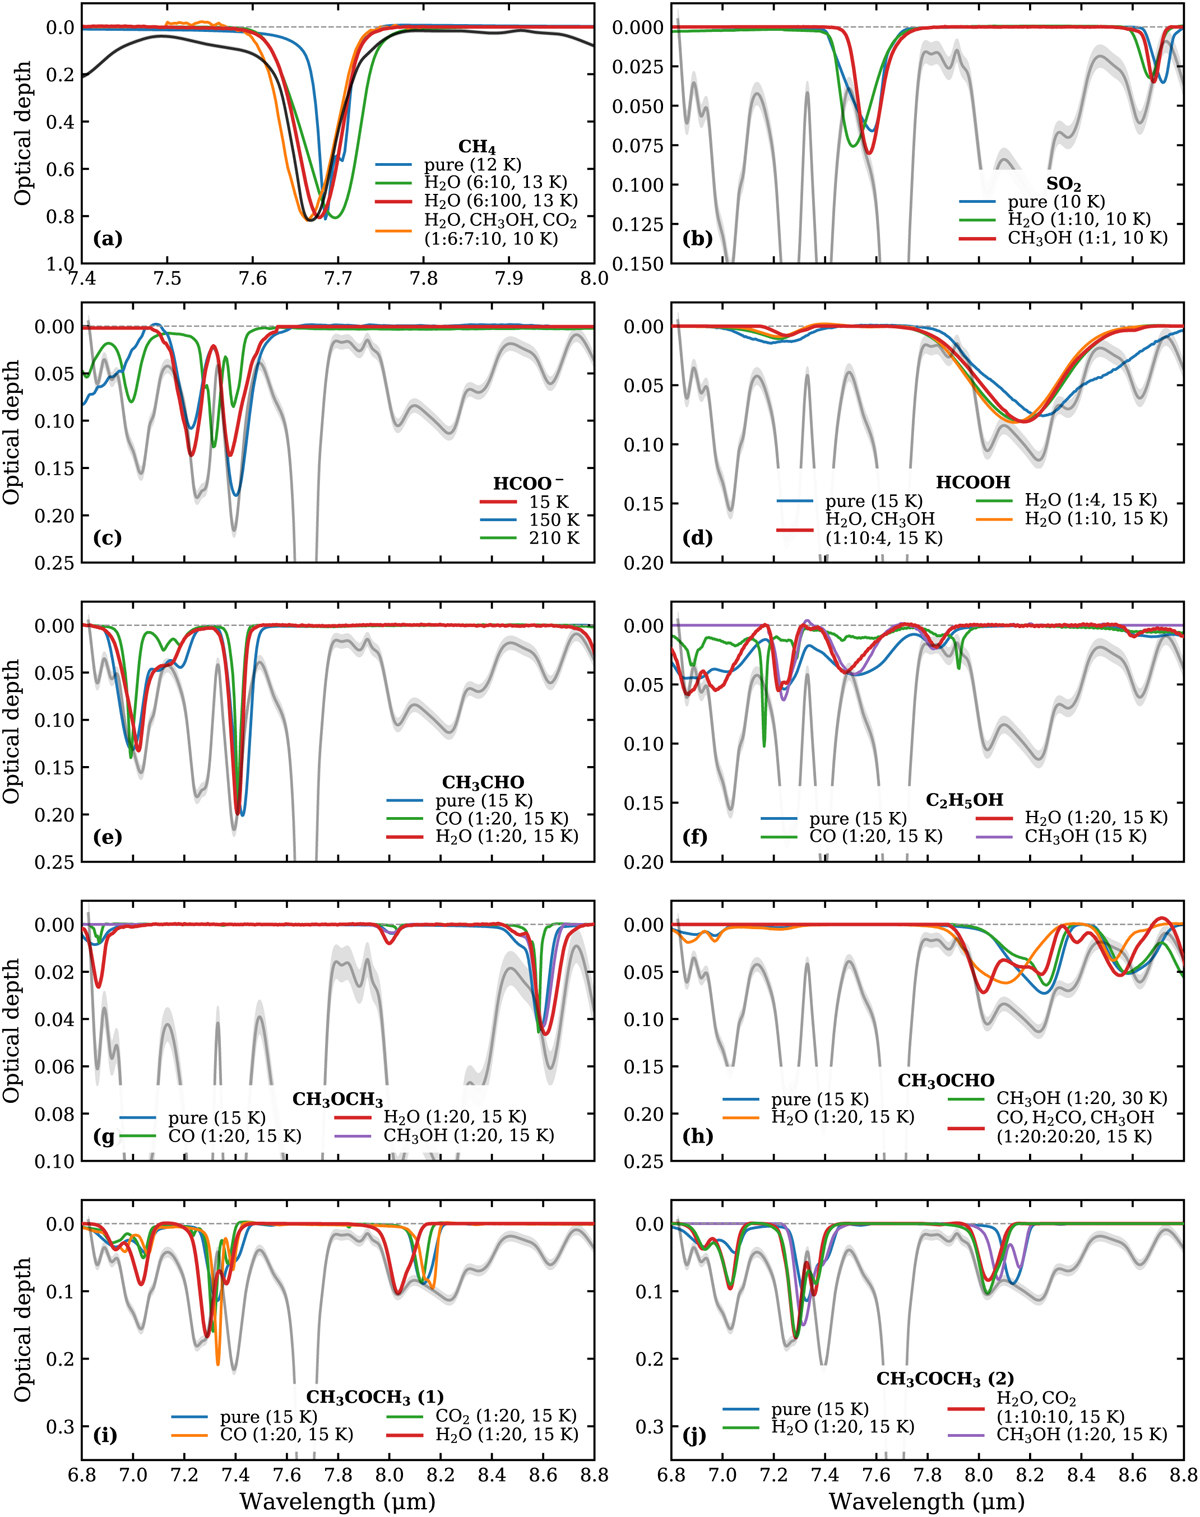
Comparison between the JWST/MIRI spectrum of B1-c (gray) and the lab spectra (colors) in the COM fingerprint range of 6.8–8.8 μm. Each panel focuses on one species and shows the comparison between the observed B1-c spectrum and the lab spectra with different mixing constituents, except for panel c, which shows the lab spectra of HCOO− under different temperatures. The observed spectrum along with the 3σ level is shown in light gray, except for panel a, which blows up the CH4 band at ~7.7 μm, and the observed spectrum is plotted in black for clarity. In each panel, the spectrum in blue corresponds to the pure ice, and the best-fit spectrum to the observations is highlighted with a thicker red line. A similar comparison but for lab spectra under different temperatures is shown in Figs. 5 and C.1.
Current usage metrics show cumulative count of Article Views (full-text article views including HTML views, PDF and ePub downloads, according to the available data) and Abstracts Views on Vision4Press platform.
Data correspond to usage on the plateform after 2015. The current usage metrics is available 48-96 hours after online publication and is updated daily on week days.
Initial download of the metrics may take a while.