Fig. 3
Download original image
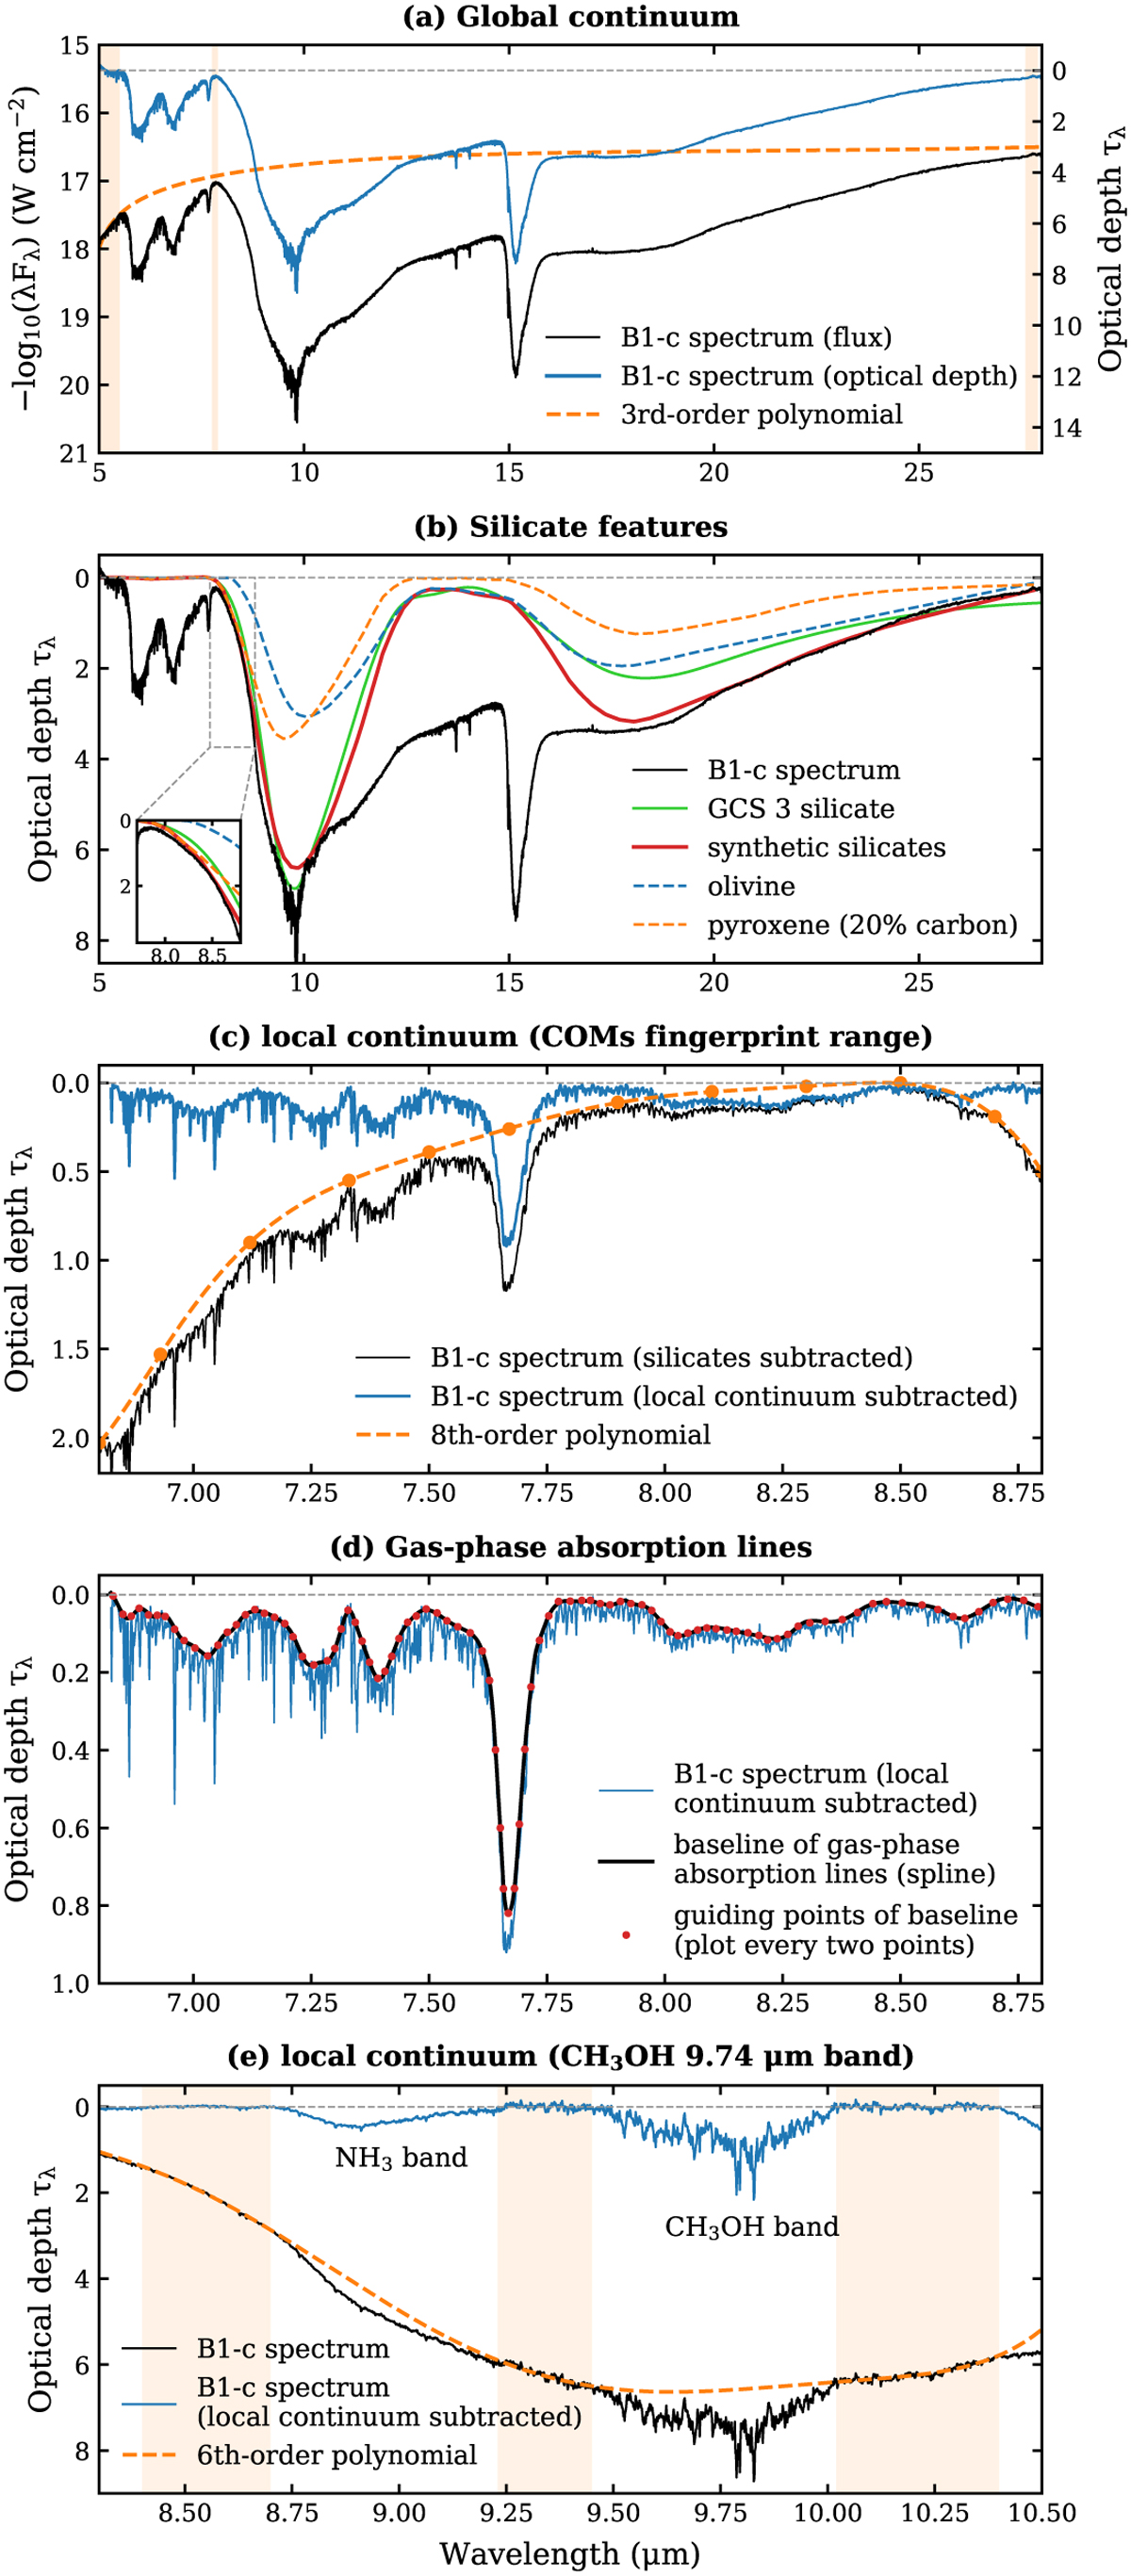
Panels a–d show the four steps to isolate the fingerprint range of COM ices between 6.8 and 8.8 μm from the original JWST/MIRI-MRS spectrum of B1-c: (a) fit a global continuum and convert the spectrum to optical depth scale; (b) subtract silicate features at ~9.8 and 18 μm; (c) trace a local continuum in the 6.8–8.8 μm range to isolate the weak bands of COM ices from other strong features; and (d) trace a baseline of the gas-phase lines in absorption to restore the band profiles of ices. Panel e shows the isolation of the CH3OH ice band at 9.74 μm by tracing a local continuum. The orange-shaded regions in panels a and e show the selected wavelength ranges for the polynomial fitting.
Current usage metrics show cumulative count of Article Views (full-text article views including HTML views, PDF and ePub downloads, according to the available data) and Abstracts Views on Vision4Press platform.
Data correspond to usage on the plateform after 2015. The current usage metrics is available 48-96 hours after online publication and is updated daily on week days.
Initial download of the metrics may take a while.