Fig. J.1
Download original image
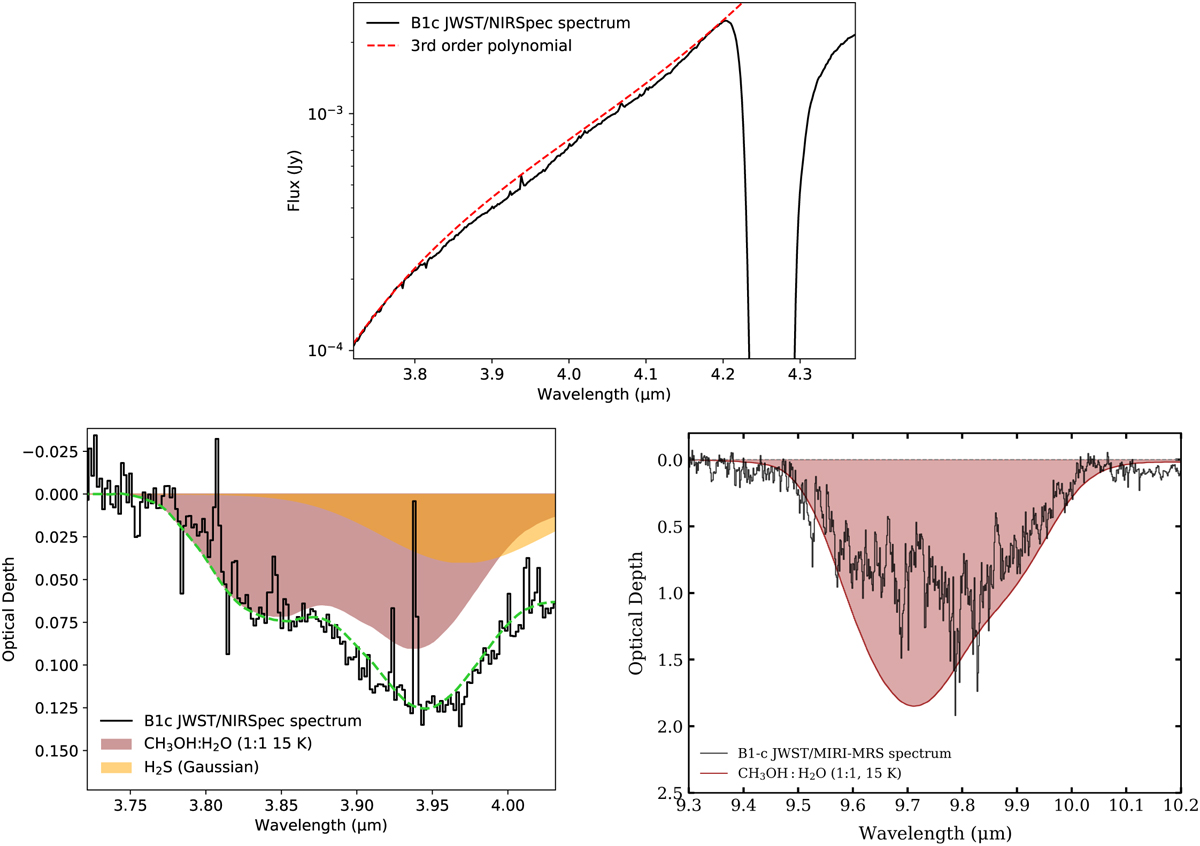
Fitting of the CH3OH bands at 3.94 and 9.74 μm. Top panel: the NIRSpec IFU spectrum of B1-c (solid black) and the local continuum of the 3.94μm CH3OH band fit by a 3rd-order polynomial (dashed red). Bottom-left panel: best-fit results of the observed absorption complex between 3.75 and 4.03 μm (black, the same as in the top panel but in optical depth scale). The shaded regions in red and yellow correspond to the CH3OH and H2S components, respectively. The overall best-fit spectrum is shown in dashed green. Bottom-right panel: the observed 9.74 μm band in the MIRI-MRS spectrum (black) overlaid with the CH3OH:H2O lab spectrum (red) scaling with the same factor as in the middle panel.
Current usage metrics show cumulative count of Article Views (full-text article views including HTML views, PDF and ePub downloads, according to the available data) and Abstracts Views on Vision4Press platform.
Data correspond to usage on the plateform after 2015. The current usage metrics is available 48-96 hours after online publication and is updated daily on week days.
Initial download of the metrics may take a while.