Fig. F.2
Download original image
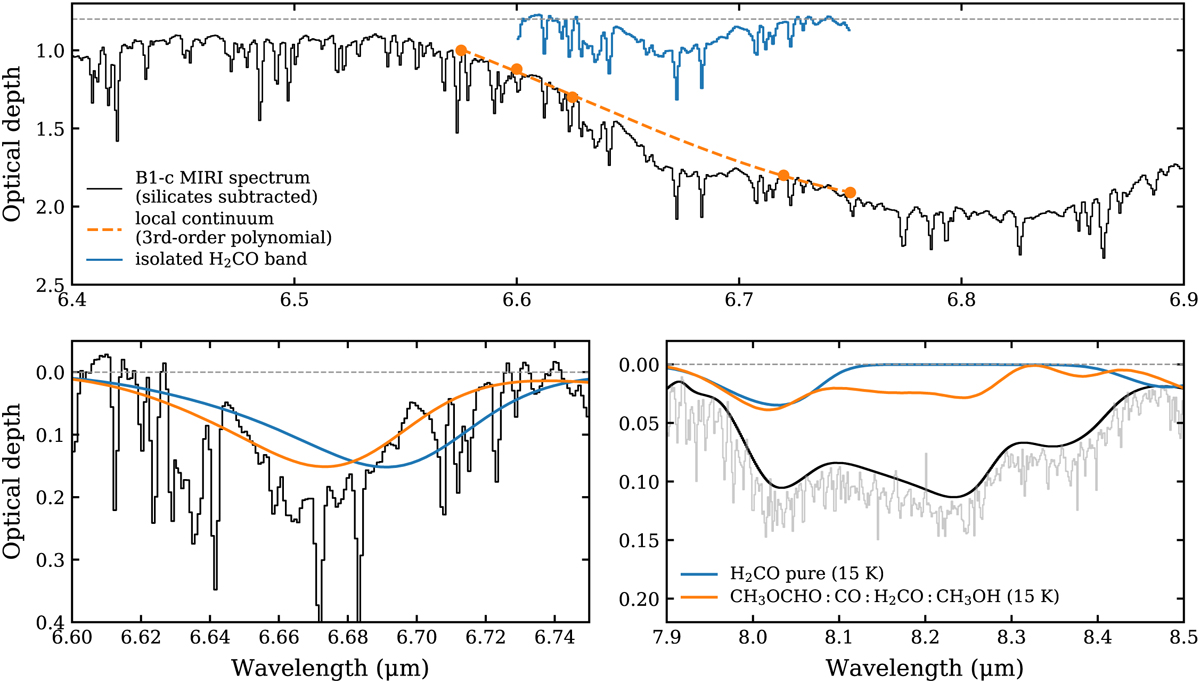
Isolation of the CH3OCHO bands from the H2CO band in the lab spectrum of the CH3OCHO:CO:H2CO:CH3OH mixture. Top panel: H2CO band at 6.67 μm (blue) isolated by tracing a local continuum (orange) to the observed spectrum (black); superposed gas-phase absorption lines of H2O are not removed here. Bottom-left panel: lab spectra of pure H2CO ice (blue) and the CH3OCHO:CO:H2CO:CH3OH mixture (orange) manually scaled to the isolated H2CO band at 6.67 μm in observations (black). Bottom-right panel: same as the middle panel but for a different wavelength range (7.9–8.5 μm).
Current usage metrics show cumulative count of Article Views (full-text article views including HTML views, PDF and ePub downloads, according to the available data) and Abstracts Views on Vision4Press platform.
Data correspond to usage on the plateform after 2015. The current usage metrics is available 48-96 hours after online publication and is updated daily on week days.
Initial download of the metrics may take a while.