Fig. 2
Download original image
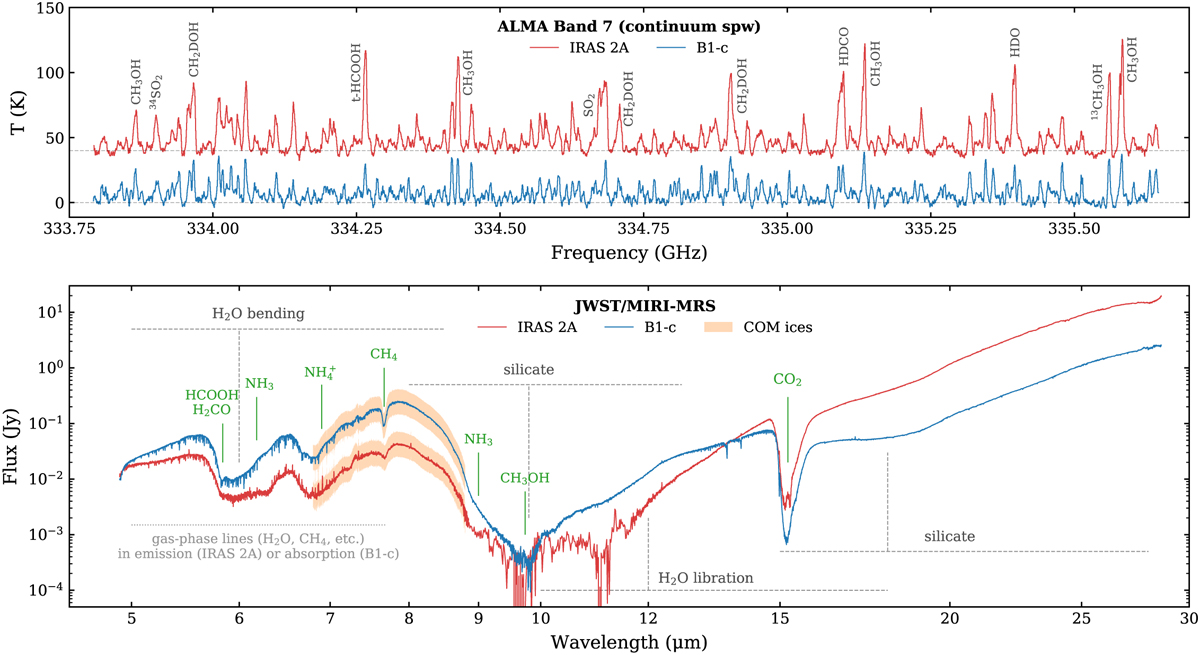
Overview of the ALMA spectra (the continuum spectral window from 333.78 to 335.65 GHz; top panel) and JWST/MIRI-MRS spectra (bottom panel) of NGC 1333 IRAS 2A and B1-c. The JWST spectrum of IRAS 2A between 8.85 and 11.7 μm was binned by a factor of ten for better visualization. In the bottom panel, the fingerprint ranges of COM ices between 6.8 and 8.8 μm are highlight in orange. Important emission lines in the ALMA spectra and absorption bands in the JWST spectra are labeled in each panel.
Current usage metrics show cumulative count of Article Views (full-text article views including HTML views, PDF and ePub downloads, according to the available data) and Abstracts Views on Vision4Press platform.
Data correspond to usage on the plateform after 2015. The current usage metrics is available 48-96 hours after online publication and is updated daily on week days.
Initial download of the metrics may take a while.