Fig. D.1
Download original image
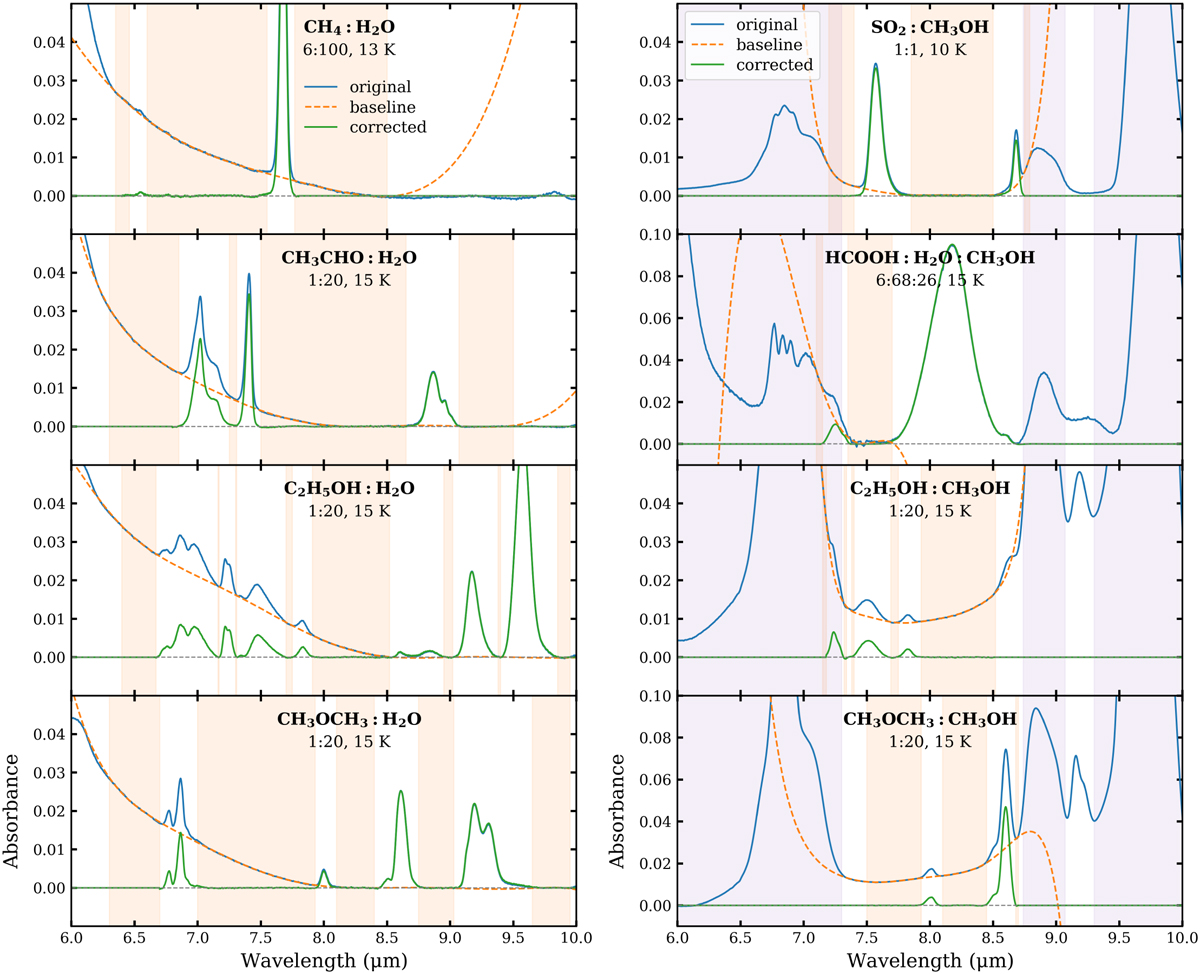
Baseline correction to lab spectra of ice mixtures. In the left panels, we take the H2O-rich mixtures of CH4 and three O-COMs (CH3CHO, C2H5OH, CH3OCH3) as examples. The original and the corrected spectra are plotted in solid blue and green, respectively. The polynomial is plotted in dashed orange, and the wavelength ranges that were selected to fit the polynomial are highlighted in orange panels. The right panels are similar to the left ones but for CH3OH mixtures. SO2, HCOOH, C2H5OH, and CH3OCH3 are taken as examples. The purple-shaded regions indicate the frequency ranges of CH3OH bands.
Current usage metrics show cumulative count of Article Views (full-text article views including HTML views, PDF and ePub downloads, according to the available data) and Abstracts Views on Vision4Press platform.
Data correspond to usage on the plateform after 2015. The current usage metrics is available 48-96 hours after online publication and is updated daily on week days.
Initial download of the metrics may take a while.