Fig. A.3
Download original image
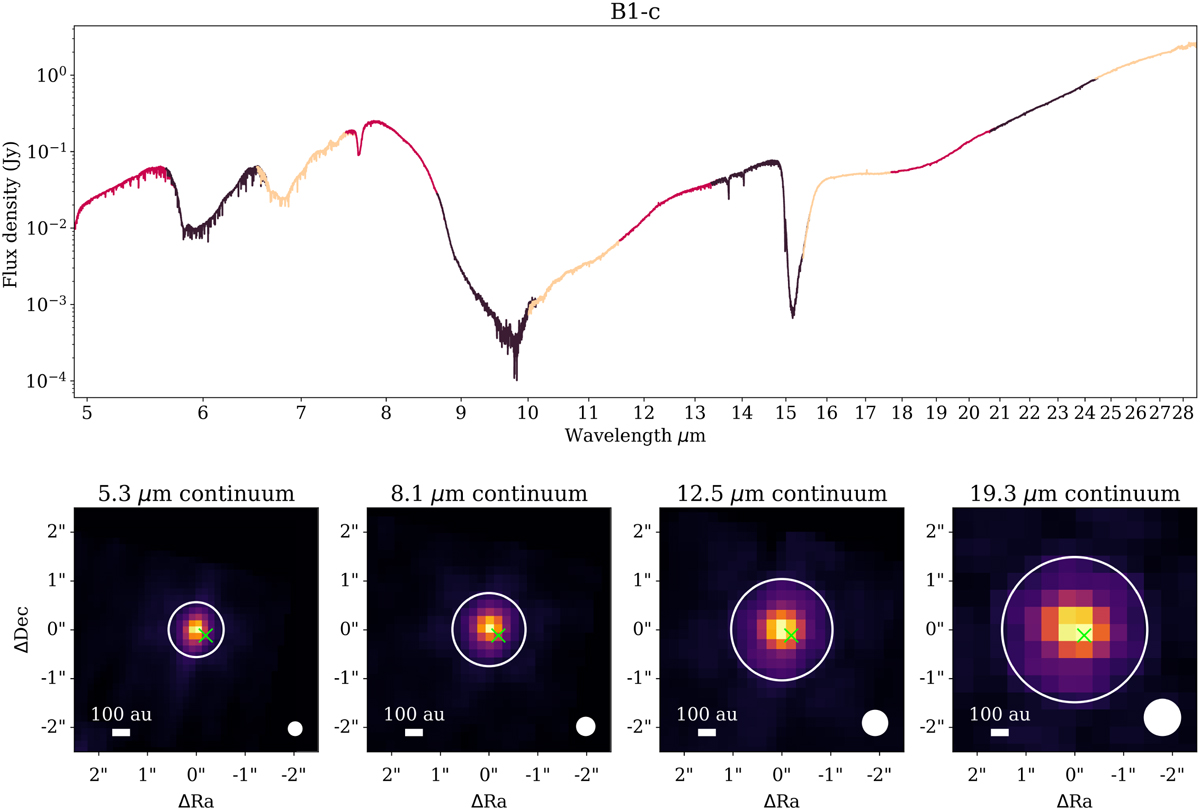
Extracted spectrum (top) and the continuum images (bottom) of JWST/MIRI-MRS observations of B1-c. Top panel: JWST/MIRI-MRS spectrum of B1-c extracted from the reduced datacubes. The spectrum slices of three sub-bands in each of the four MIRI-MRS Channels are distinguished in three different colors. Bottom panels: continuum images in four Channels (1: 4.9–7.65 μm; 2: 7.51–11.7 μm; 3: 11.55–17.98 μm; 4: 17.7–27.9 μm). The sizes of the PSF and the aperture for spectrum extraction increase as a function of wavelength, and are denoted by white circles, respectively. The extraction position of the ALMA spectrum (also the continuum peak) in Fig. A.2 is marked here using the same green cross. The ALMA extraction position is well within the MIRI apertures, and the small offset to the aperture center is likely due to the lower accuracy of the JWST pointing.
Current usage metrics show cumulative count of Article Views (full-text article views including HTML views, PDF and ePub downloads, according to the available data) and Abstracts Views on Vision4Press platform.
Data correspond to usage on the plateform after 2015. The current usage metrics is available 48-96 hours after online publication and is updated daily on week days.
Initial download of the metrics may take a while.