Fig. A.1

Download original image
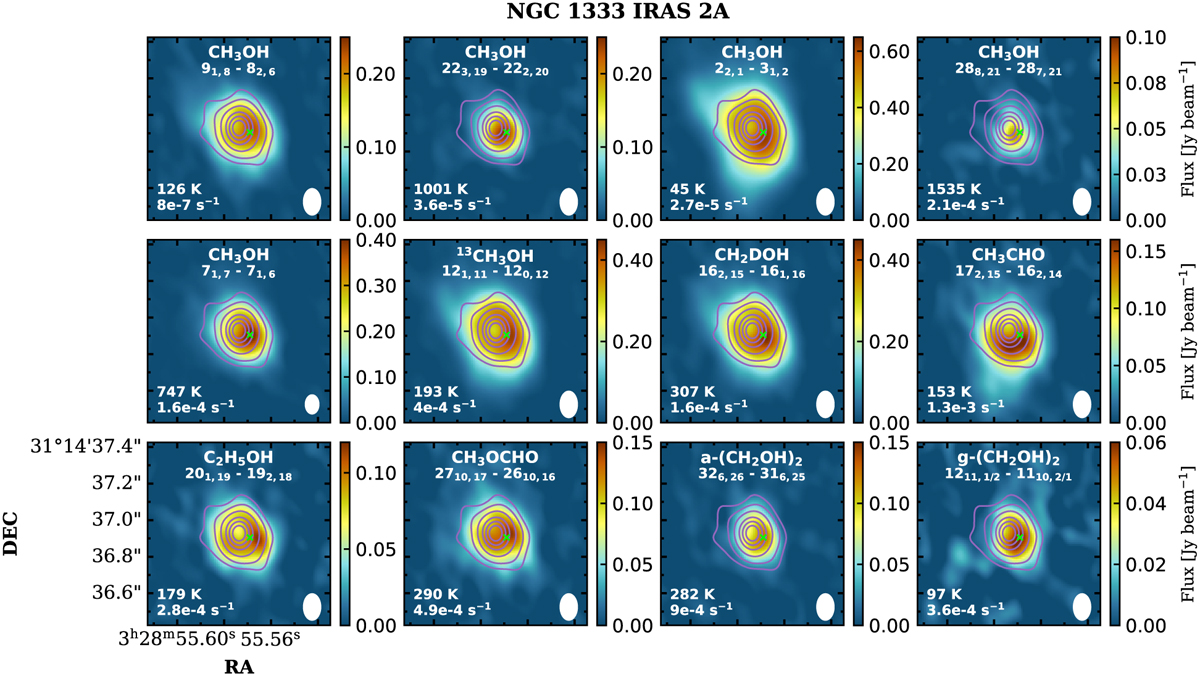
Integrated intensity maps (i.e., moment 0 maps) of 12 emission lines of eight O-COMs in NGC 1333 IRAS 2A. The quantum numbers, Eup, Aij of each transition are labeled in white text. The contours in light purple indicate the continuum emission at the 30, 50, 100, 200, 300, 400, and 500σ levels (σ = 0.2 mJy beam−1). The beam size (0.1″ × 0.15″) is denoted by white ellipses in the lower right, and the pixel where the spectrum was extracted is marked by a green cross in each panel. The beam size in the fifth panel is slightly smaller (0.08″ × 0.11″), since this transition lies in a different spectral window than the others.
Current usage metrics show cumulative count of Article Views (full-text article views including HTML views, PDF and ePub downloads, according to the available data) and Abstracts Views on Vision4Press platform.
Data correspond to usage on the plateform after 2015. The current usage metrics is available 48-96 hours after online publication and is updated daily on week days.
Initial download of the metrics may take a while.


