Fig. 11
Download original image
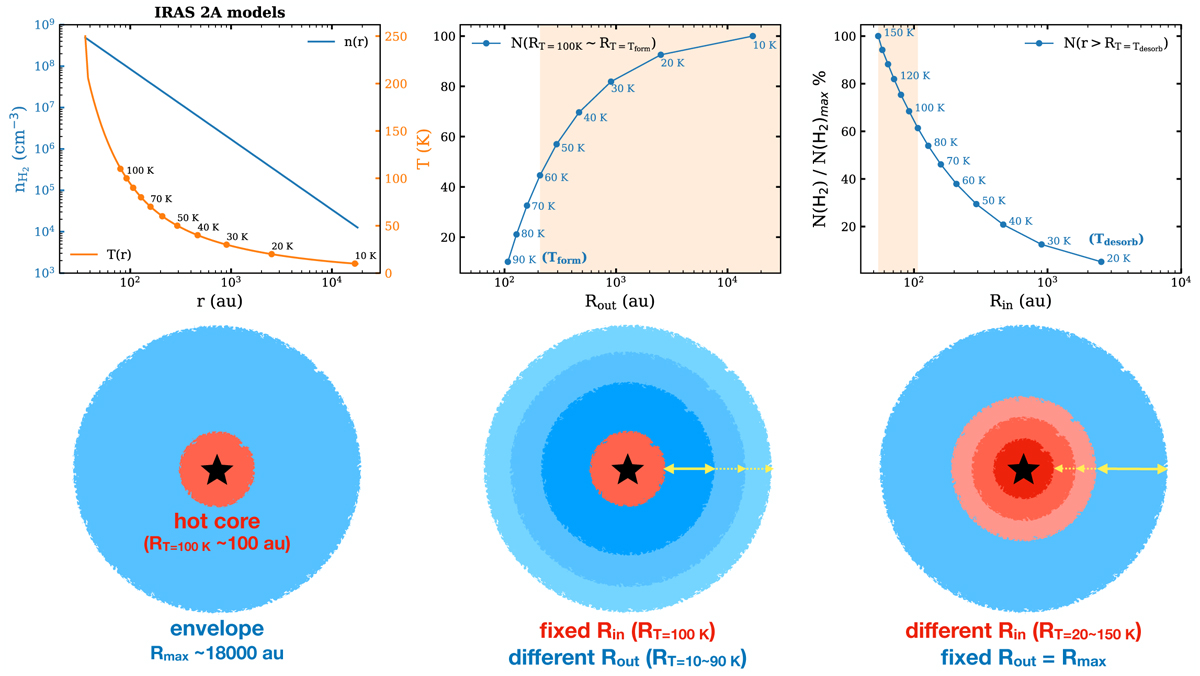
One-dimension model of IRAS 2A and the integrated H2 column densities (top panels), along with the explanatory cartoons (bottom panels). Top left: H2 number density (blue) and temperature (orange) profiles of the physical model of IRAS 2A (Kristensen et al. 2012). Top middle: normalized H2 column densities in envelopes with a fixed inner radius (where T = 100 K) and different outer radii (where T = 10–90 K). Top right: normalized H2 column density in an envelope with a fixed outer radius (the max radius in the model, ~18000 au) and different inner radii (where T = 20–150 K). In the top middle and right panels, each point corresponds to an H2 column density; that is, the integrated H2 number density (top left panel) from an inner radius to an outer one. The orange shaded regions indicate the likely inner or outer radii in real cases. Bottom panels show corresponding cartoons of the toy model. Hot cores and envelopes are colored in red and blue, respectively. In the bottom middle and right panels, yellow arrows indicate the span of envelopes with different outer or inner radii.
Current usage metrics show cumulative count of Article Views (full-text article views including HTML views, PDF and ePub downloads, according to the available data) and Abstracts Views on Vision4Press platform.
Data correspond to usage on the plateform after 2015. The current usage metrics is available 48-96 hours after online publication and is updated daily on week days.
Initial download of the metrics may take a while.