Fig. 1
Download original image
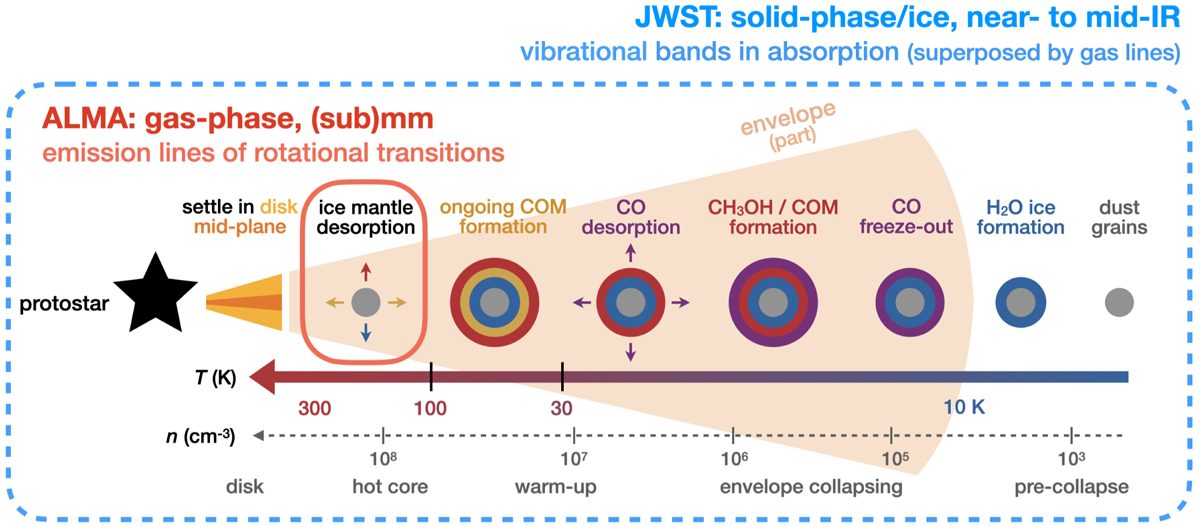
Schematic of chemical evolution on dust grains in protostellar stages, modified from Fig. 1.4 of van’t Hoff (2019) and Fig. 14 of Herbst & van Dishoeck (2009). Ice layers are dominated by different species (e.g., H2O, CO, and COMs) that are denoted in different colors. The typical temperature and density in different evolutionary stages are labeled on arrows in the bottom. The small red box indicates the hot core region where the temperature is high enough (>100 K) to sublimate most of the volatile materials, and therefore the gas-phase molecules can be traced by radio telescopes at (sub)millimeter wavelengths. The big blue box indicates that IR telescopes such as JWST are tracing everything along the line of sight, including ice in the vast envelope and gas in the hot core.
Current usage metrics show cumulative count of Article Views (full-text article views including HTML views, PDF and ePub downloads, according to the available data) and Abstracts Views on Vision4Press platform.
Data correspond to usage on the plateform after 2015. The current usage metrics is available 48-96 hours after online publication and is updated daily on week days.
Initial download of the metrics may take a while.