Open Access
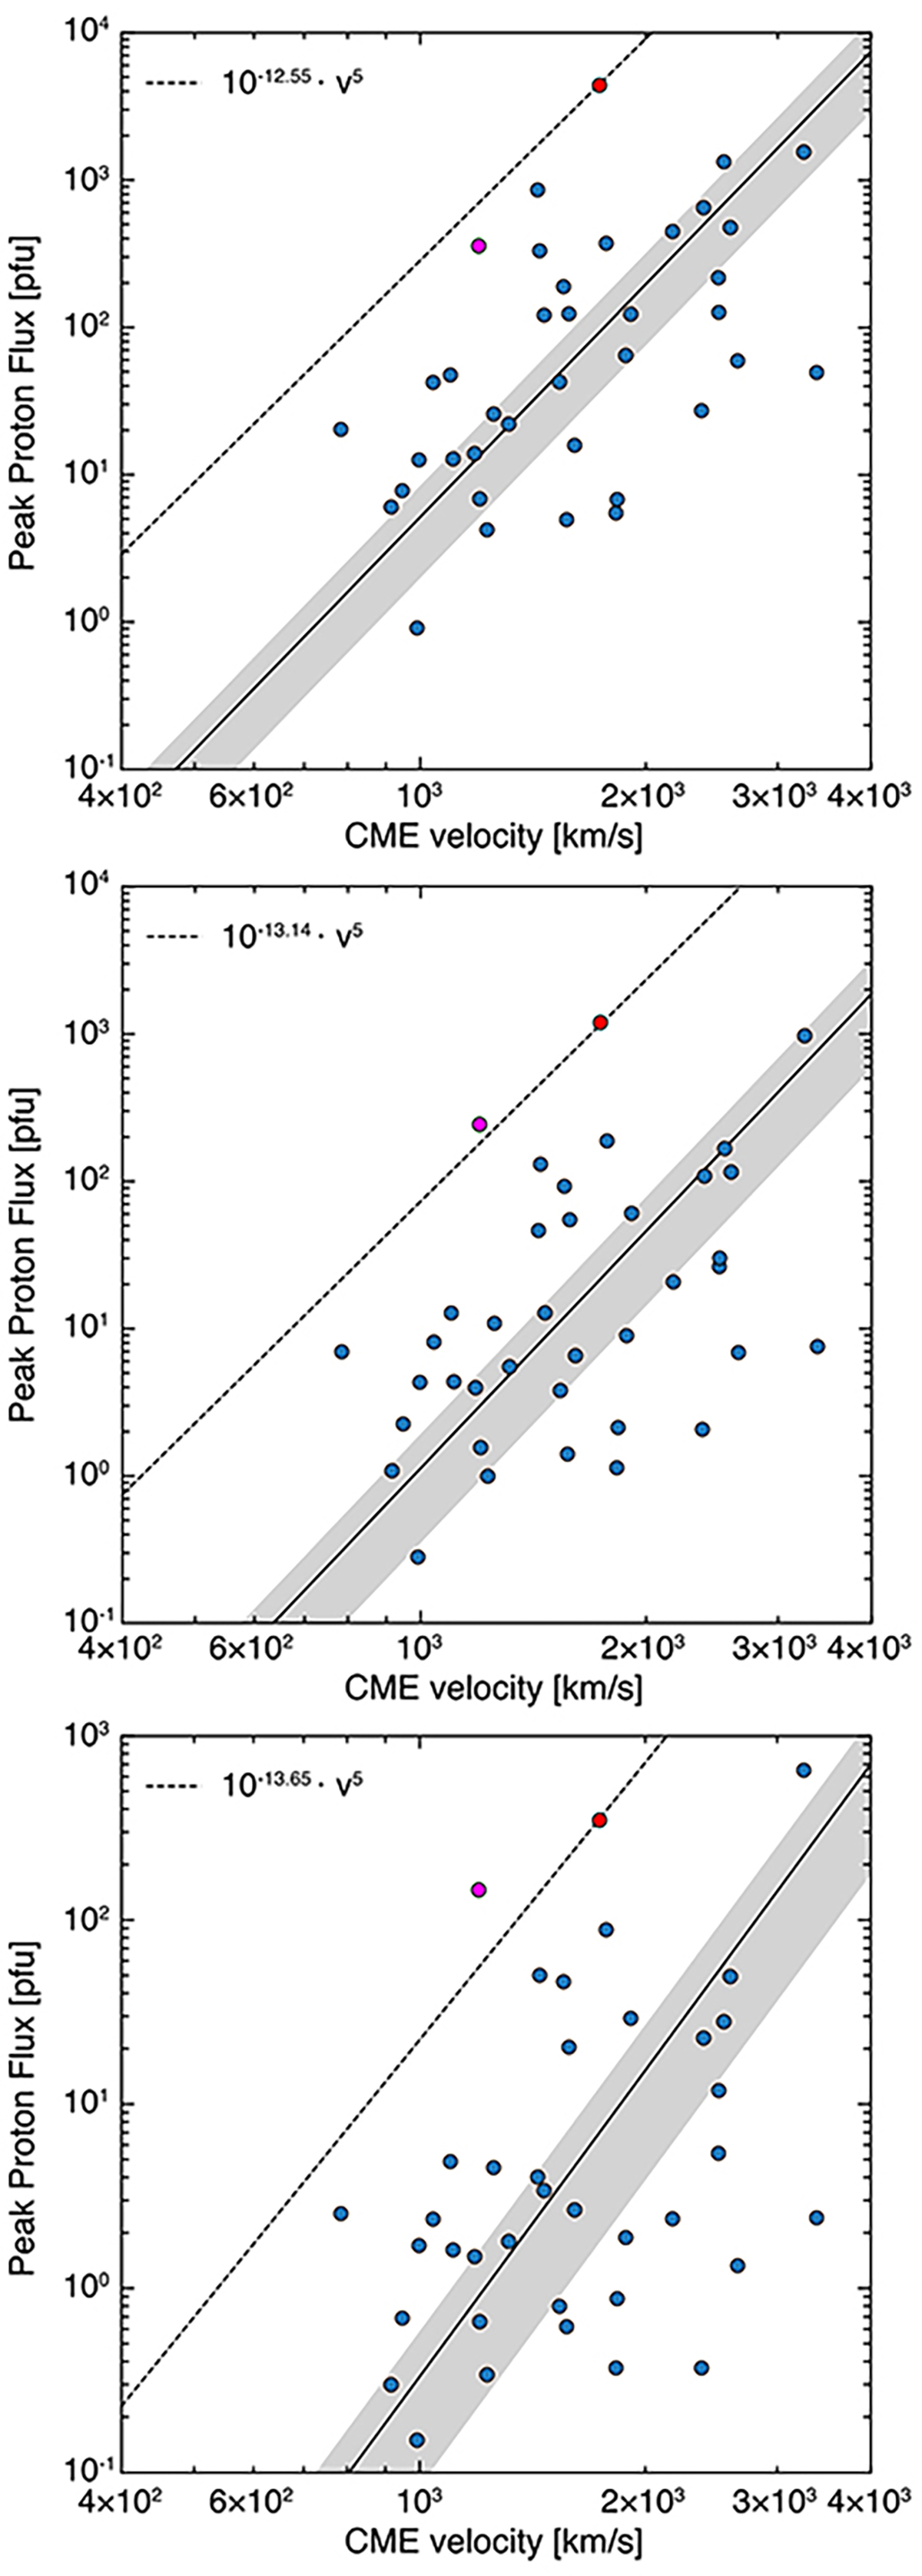
Fig. A.1.
Download original image
Similar to Fig. 1. From top to bottom, these panels present results for E> 30-; E> 60-, and E> 100 MeV, respectively. In all panels, the red dot corresponds to the 8 November 2000 outstanding large SEP event (see text for further details).
Current usage metrics show cumulative count of Article Views (full-text article views including HTML views, PDF and ePub downloads, according to the available data) and Abstracts Views on Vision4Press platform.
Data correspond to usage on the plateform after 2015. The current usage metrics is available 48-96 hours after online publication and is updated daily on week days.
Initial download of the metrics may take a while.