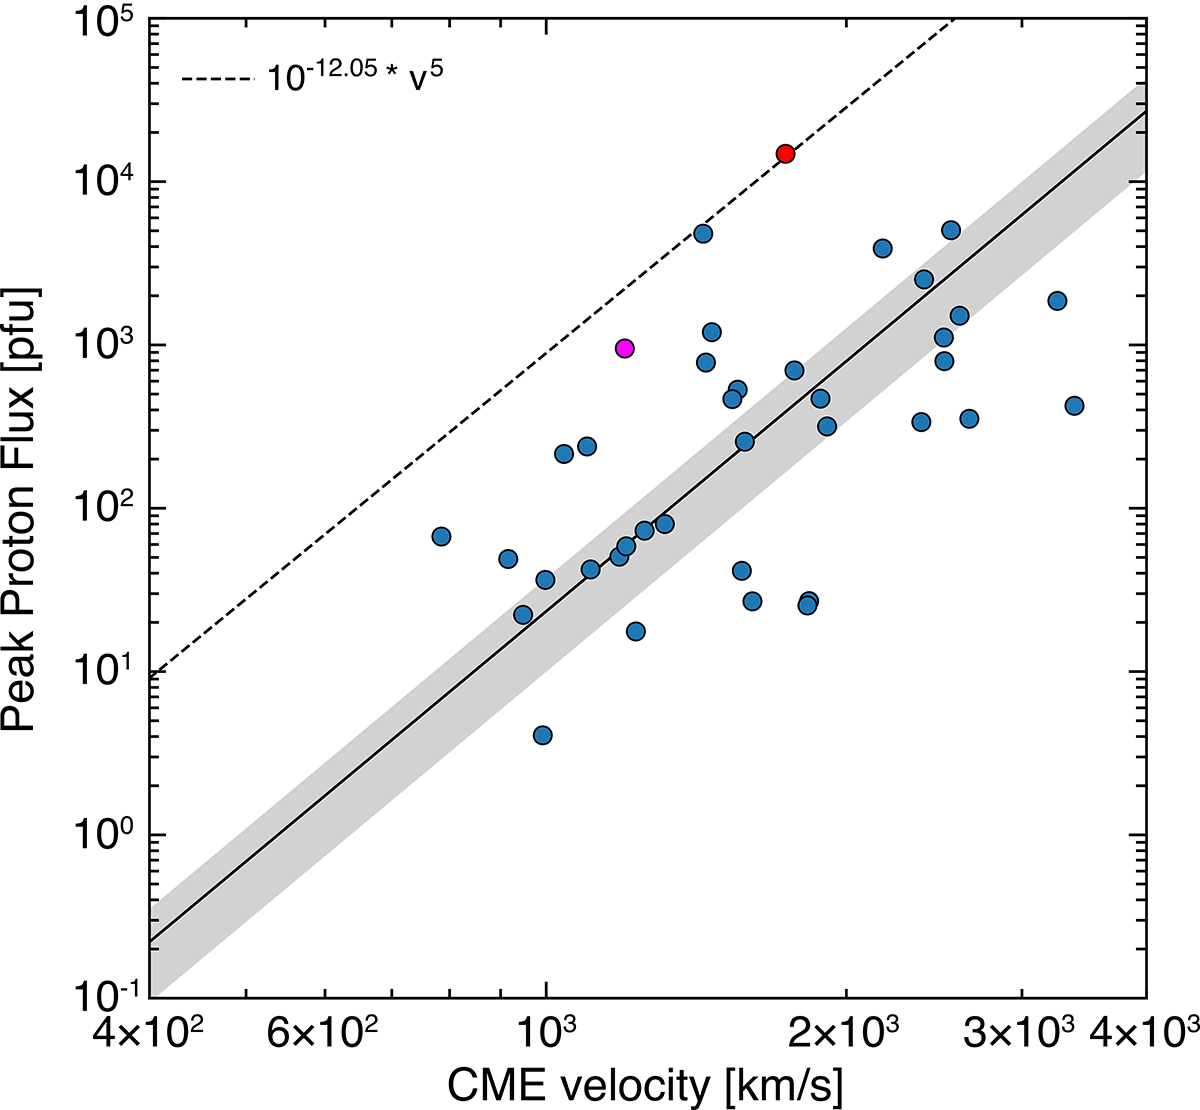
Fig. 1.
Download original image
IP ∝ VCMEγ relation for E > 10 MeV, with γ = 5.09 ± 0.78. The dashed black line corresponds to the upper limit of IP in terms of VCME with γ = 5. The upper point in our sample corresponds to the SEP event on 8 November 2000 (see the relevant appendix in part I) and is used for the scaling. It is labeled with a red dot. In addition, the event on 15 April 2001 is highlighted with a magenta dot (see details in the text).
Current usage metrics show cumulative count of Article Views (full-text article views including HTML views, PDF and ePub downloads, according to the available data) and Abstracts Views on Vision4Press platform.
Data correspond to usage on the plateform after 2015. The current usage metrics is available 48-96 hours after online publication and is updated daily on week days.
Initial download of the metrics may take a while.