Fig. 9.
Download original image
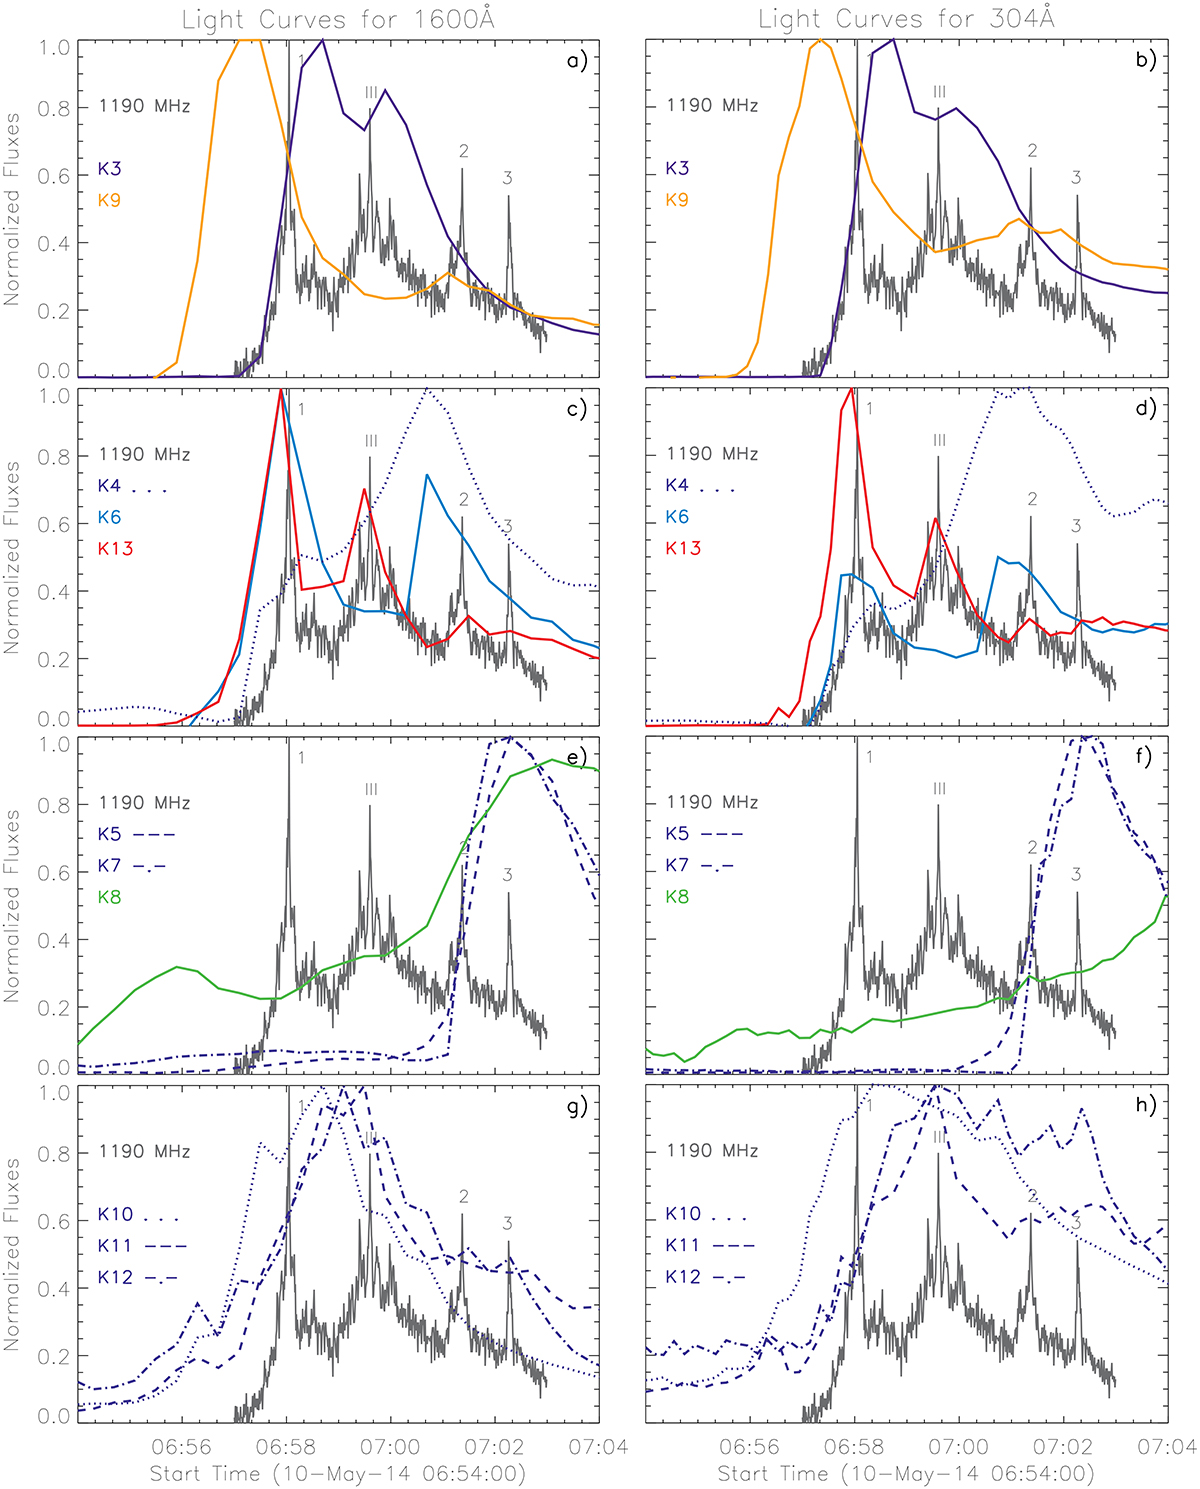
Comparison of temporal evolution of UV/EUV light curves from flare kernels K3–K13 (see Fig. 4c) with the normalized radio flux at 1190 MHz (grey). The radio peaks corresponding to groups of SPDBs are labelled 1, 2, and 3, and III denotes narrow-band type III bursts. (a) For UV filter 1600 Å and (b) for EUV filter 304 Å. The individual kernels are indicated by different colours or linestyles.
Current usage metrics show cumulative count of Article Views (full-text article views including HTML views, PDF and ePub downloads, according to the available data) and Abstracts Views on Vision4Press platform.
Data correspond to usage on the plateform after 2015. The current usage metrics is available 48-96 hours after online publication and is updated daily on week days.
Initial download of the metrics may take a while.