Fig. 6.
Download original image
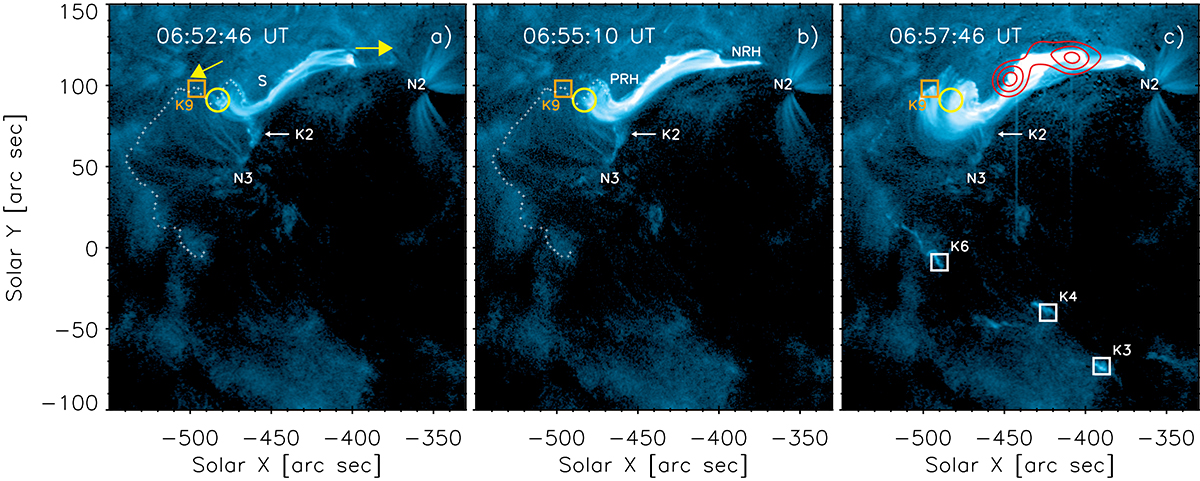
Interaction of S with the half dome. The tiny white crosses show the border of the half dome in (a) and (b). In each panel N2 and N3 give the positions of the negative sunspots, K1 is located at the centre of the yellow circle, the white arrow points to K2, and the orange square at the border of the half dome locates K9. The yellow arrows in (a) denote the direction of the evolution of the hooks PRH and NRH (shown in b); the white squares show K3, K4, and K6. The red contours in (c) show the positions of HXR (25–50 keV) at 06:57:40–06:58:33 UT with 50, 70, and 90% of the maximum.
Current usage metrics show cumulative count of Article Views (full-text article views including HTML views, PDF and ePub downloads, according to the available data) and Abstracts Views on Vision4Press platform.
Data correspond to usage on the plateform after 2015. The current usage metrics is available 48-96 hours after online publication and is updated daily on week days.
Initial download of the metrics may take a while.