Fig. 4.
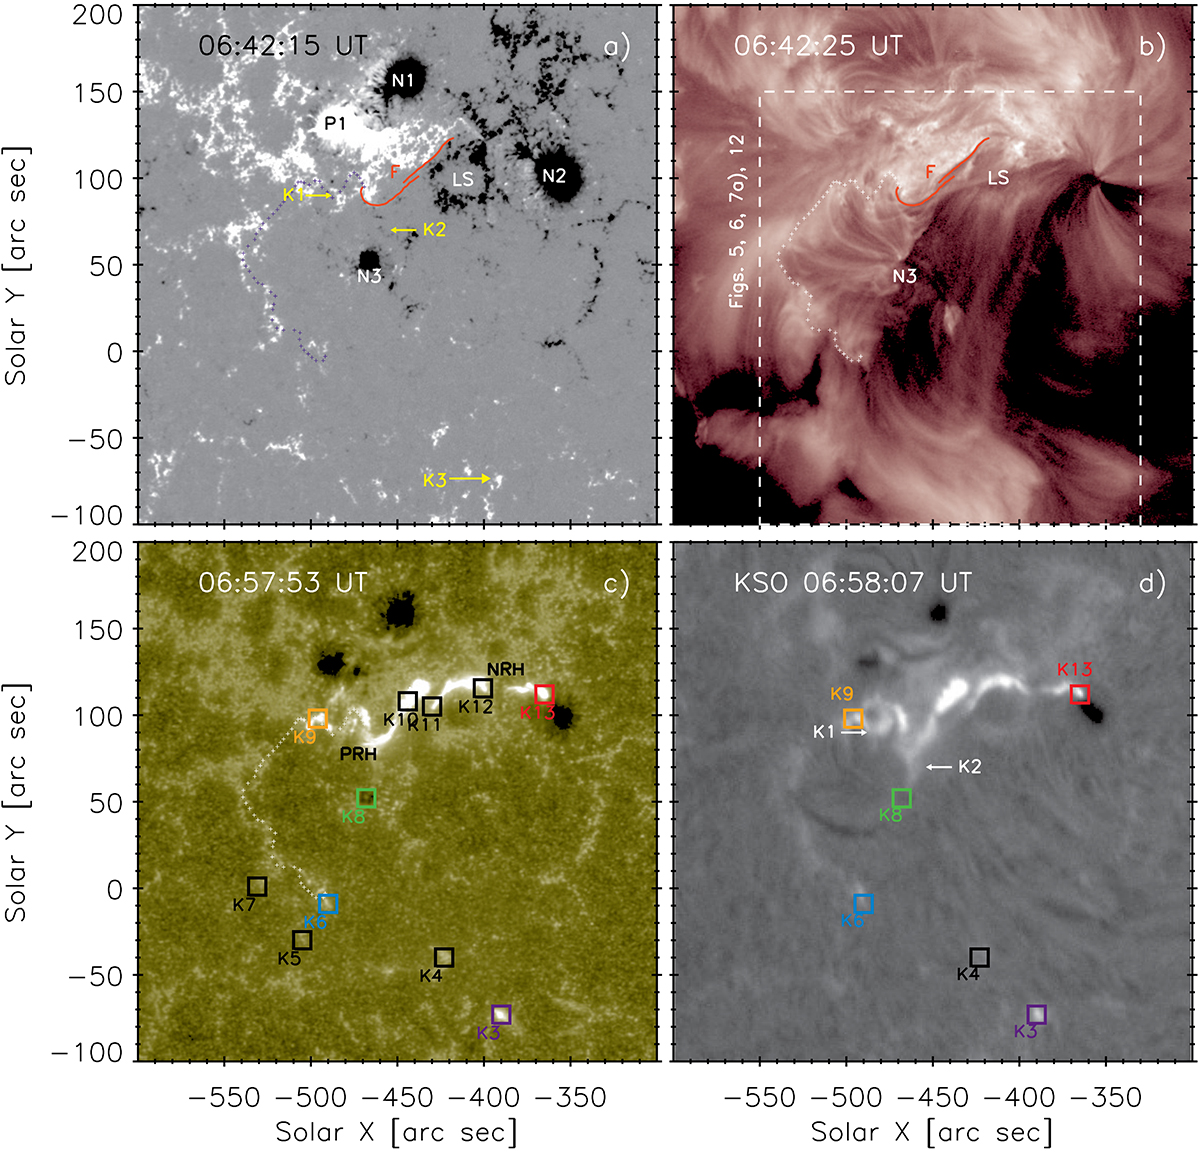
Download original image
Overview of active region and flare kernels. (a) SDO/HMI line-of-sight magnetogram (±300 G): P1, N1, N2, N3 – sunspots; LS – large supergranule; F – filament (red lines); K1, K2, and K3 – flare kernels (yellow arrows); and border of the half dome structure (tiny dark blue crosses). (b) SDO/AIA image in 211 Å showing the loops of the half dome and filament F (red lines). The border of the half dome is shown by white crosses (also in c). The dashed rectangle is the field of view for Figs. 5, 6, 7a, and 12. (c) SDO/AIA 1600 Å image showing ribbons and their positive and negative polarity ribbon hooks (PRH and NRH, respectively). The coloured and numbered squares show the locations of particular flare kernels. (d) KSO Hα image showing the positions of the flare kernels at the beginning of the flare (K1, K2 – arrows), and those resembling the model of 3D magnetic reconnection (K3, K4, K6, K8, K9, K13).
Current usage metrics show cumulative count of Article Views (full-text article views including HTML views, PDF and ePub downloads, according to the available data) and Abstracts Views on Vision4Press platform.
Data correspond to usage on the plateform after 2015. The current usage metrics is available 48-96 hours after online publication and is updated daily on week days.
Initial download of the metrics may take a while.