Fig. 2.
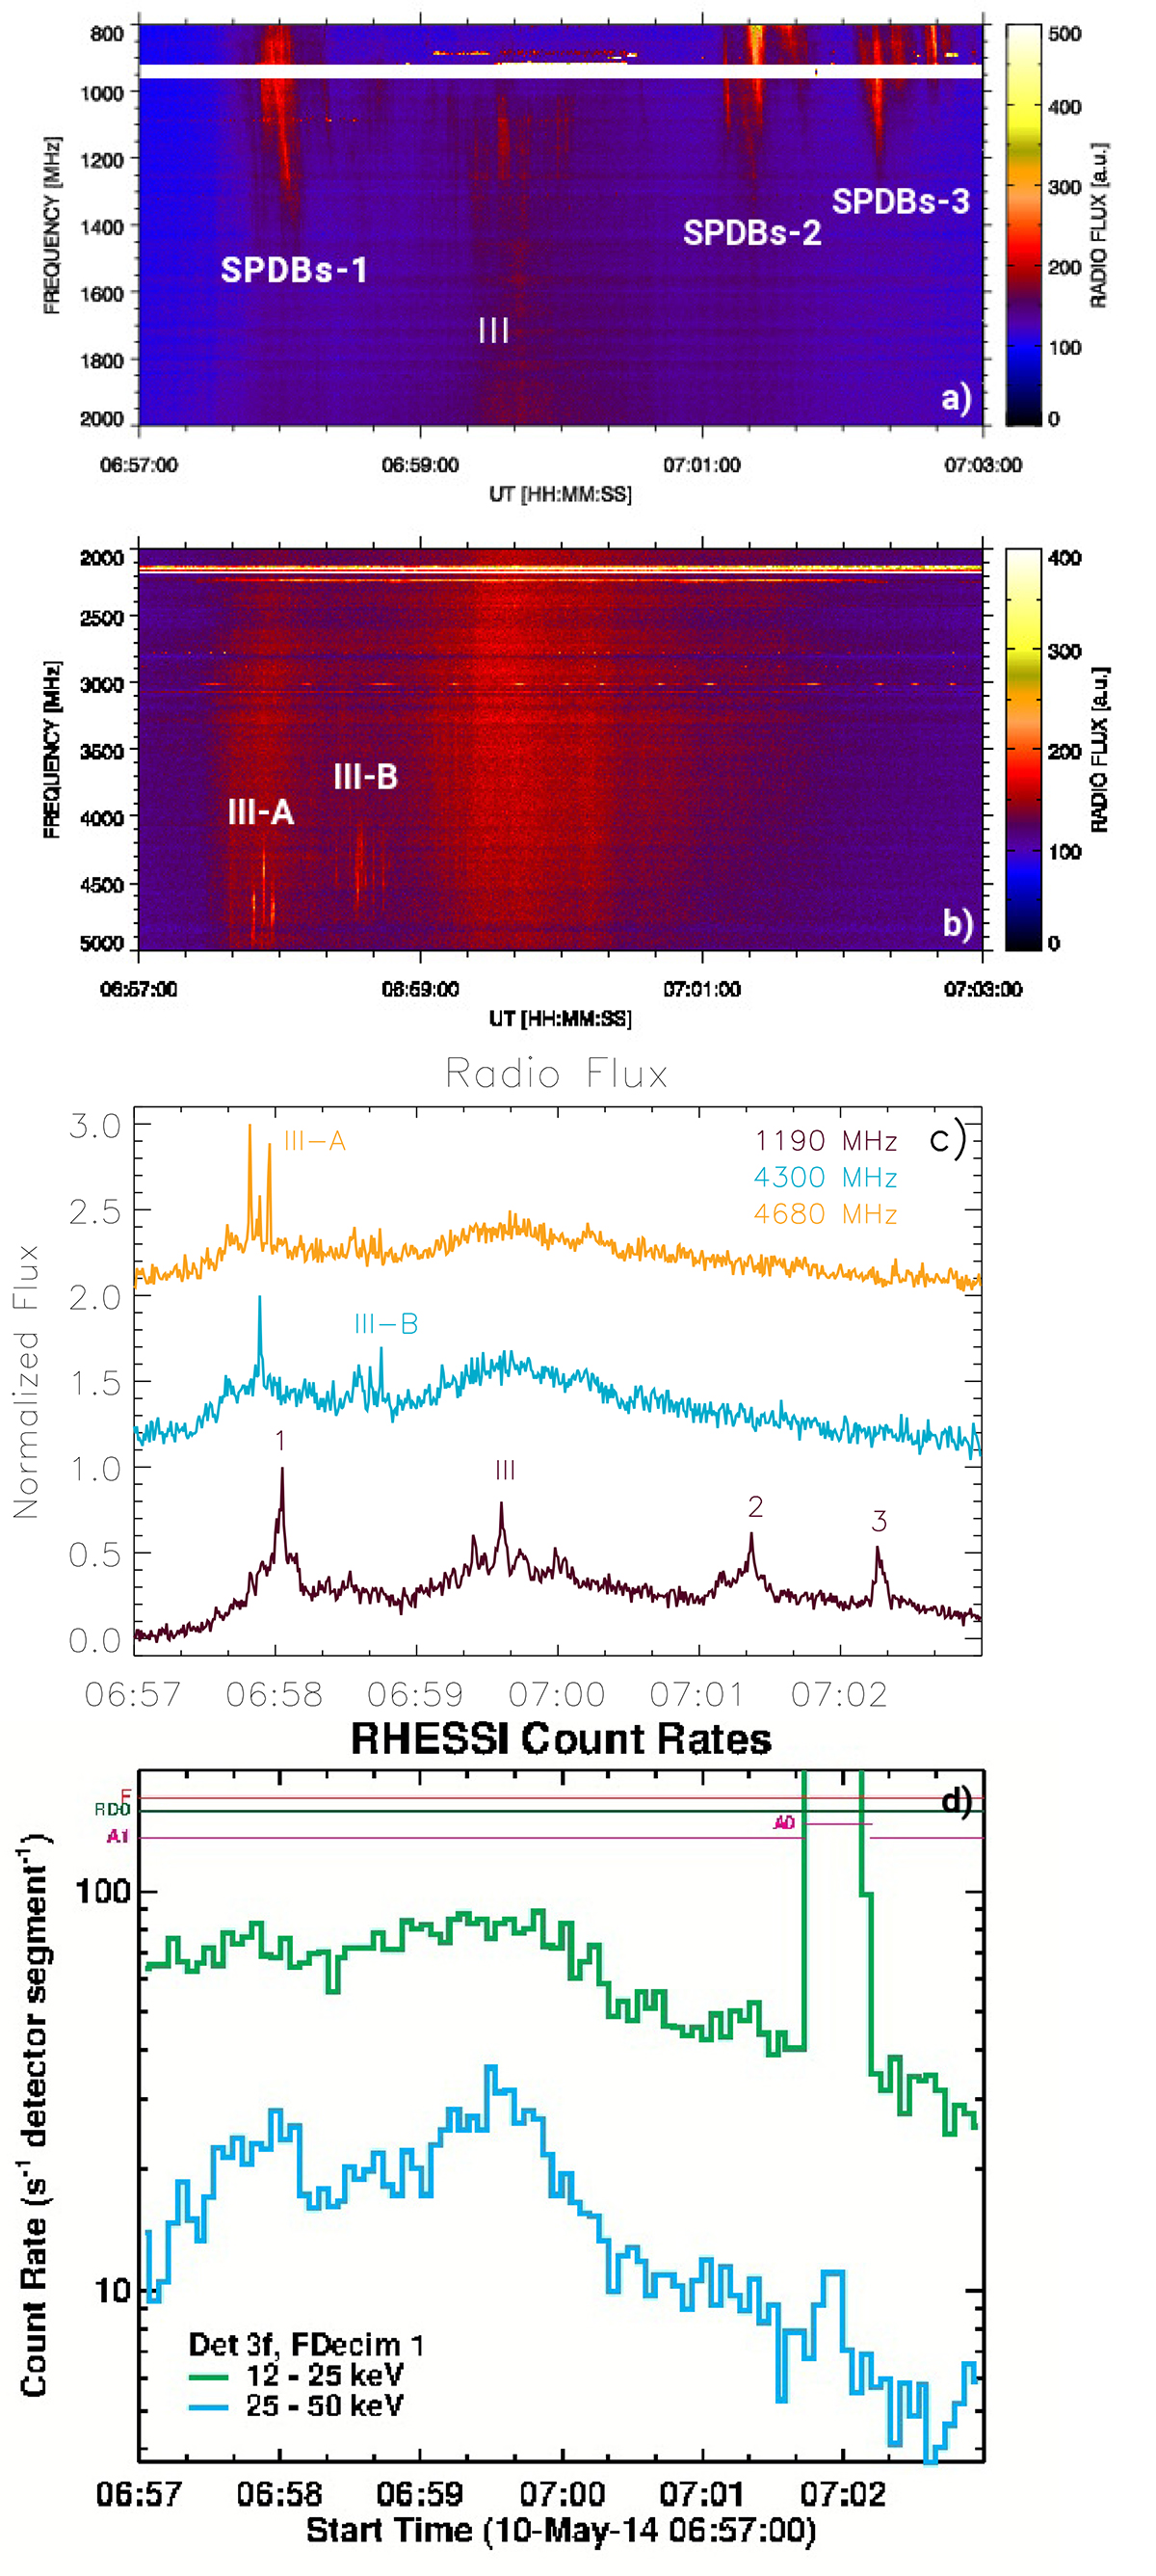
Download original image
Spectra from the Ondřejov radiospectrographs and RHESSI HXR light curves. The radio spectrum in 800–2000 MHz (RT5) (a), in 2000–5000 MHz (RT4) (b), cuts through spectra at 1190, 4300, 4680 MHz (c). Each cut was normalized to its maximum flux and, for clarity, plotted by adding a constant (0, 1.0, 2.0, respectively). Individual groups of SPDBs are labelled 1, 2, and 3 and type III bursts are labelled III, III-A, III-B; RHESSI HXR light curves for two energy channels and detector 3: 12−25 keV in green and 25−50 keV in blue (d). The sudden jump in HXR rates at about 07:02 UT is due to attenuator change.
Current usage metrics show cumulative count of Article Views (full-text article views including HTML views, PDF and ePub downloads, according to the available data) and Abstracts Views on Vision4Press platform.
Data correspond to usage on the plateform after 2015. The current usage metrics is available 48-96 hours after online publication and is updated daily on week days.
Initial download of the metrics may take a while.