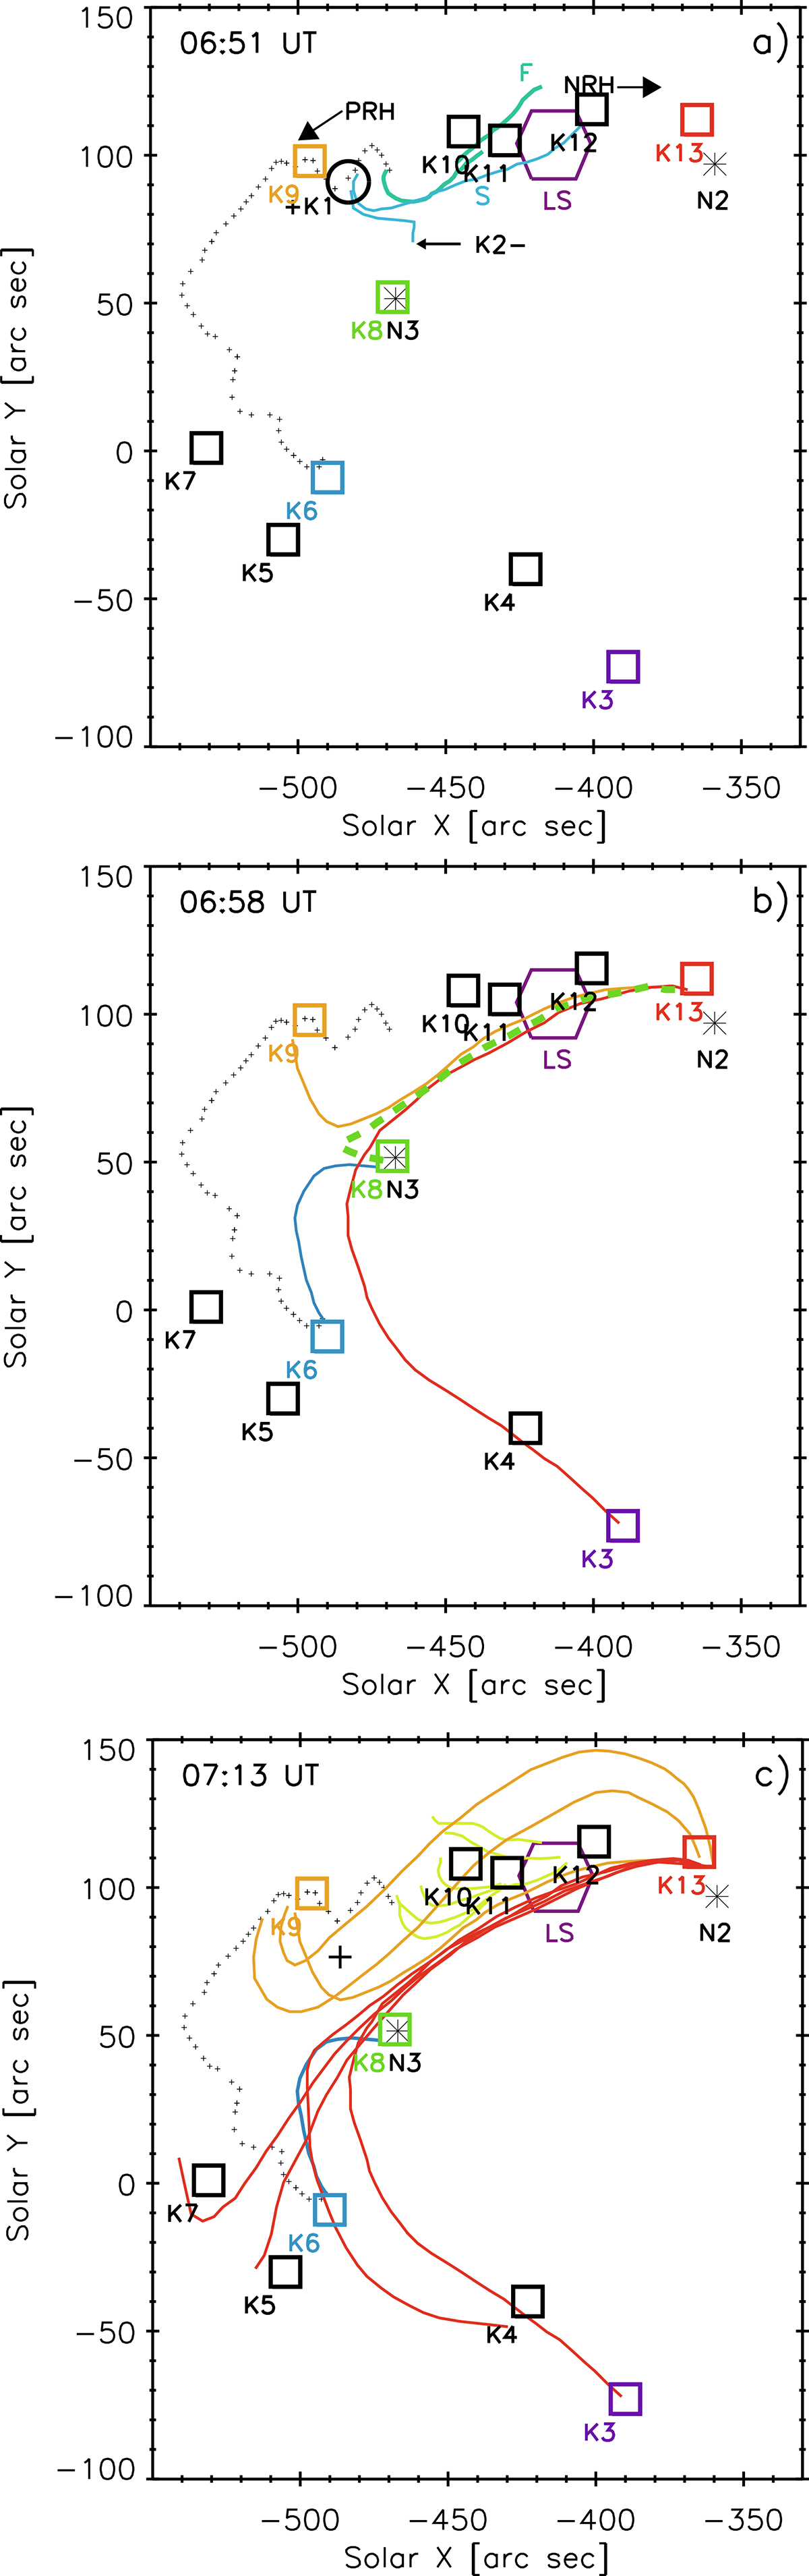
Fig. 12.
Download original image
Schema of the flare and evolution of individual magnetic connections during it. The asterisks indicate the positions of sunspots N2 and N3. Tiny black crosses denote the half dome. Individual kernels are marked by squares, while coloured lines stand for different magnetic connections. See text of Sect. 5.2 for details on individual structures.
Current usage metrics show cumulative count of Article Views (full-text article views including HTML views, PDF and ePub downloads, according to the available data) and Abstracts Views on Vision4Press platform.
Data correspond to usage on the plateform after 2015. The current usage metrics is available 48-96 hours after online publication and is updated daily on week days.
Initial download of the metrics may take a while.