Open Access
Fig. 11.
Download original image
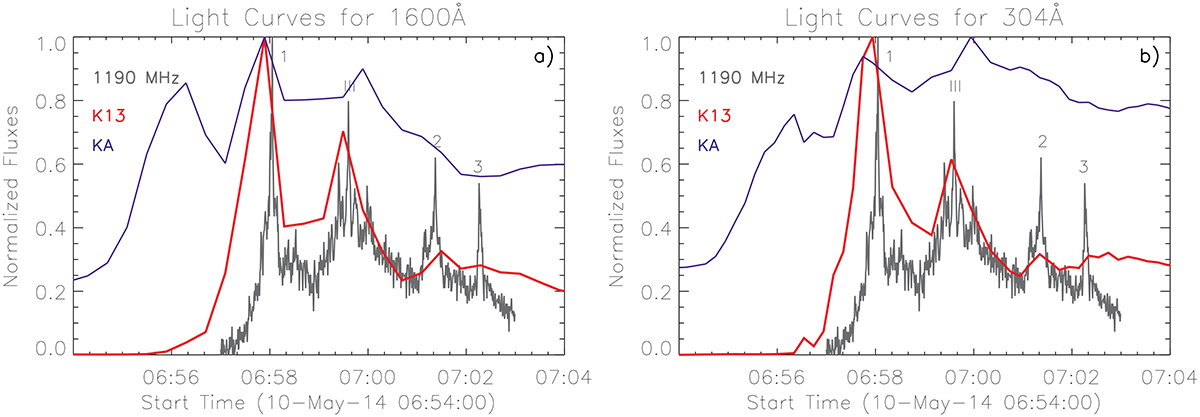
Comparison of light curves from kernel K13 located in active region NOAA 12 056 and kernel KA located in NOAA 12 055. (a) Light curves from the 1600 Å filter and (b) for the 304 Å filter. K13 is in red and KA in dark blue. The normalized radio flux at 1190 MHz is in grey.
Current usage metrics show cumulative count of Article Views (full-text article views including HTML views, PDF and ePub downloads, according to the available data) and Abstracts Views on Vision4Press platform.
Data correspond to usage on the plateform after 2015. The current usage metrics is available 48-96 hours after online publication and is updated daily on week days.
Initial download of the metrics may take a while.