Fig. 10.
Download original image
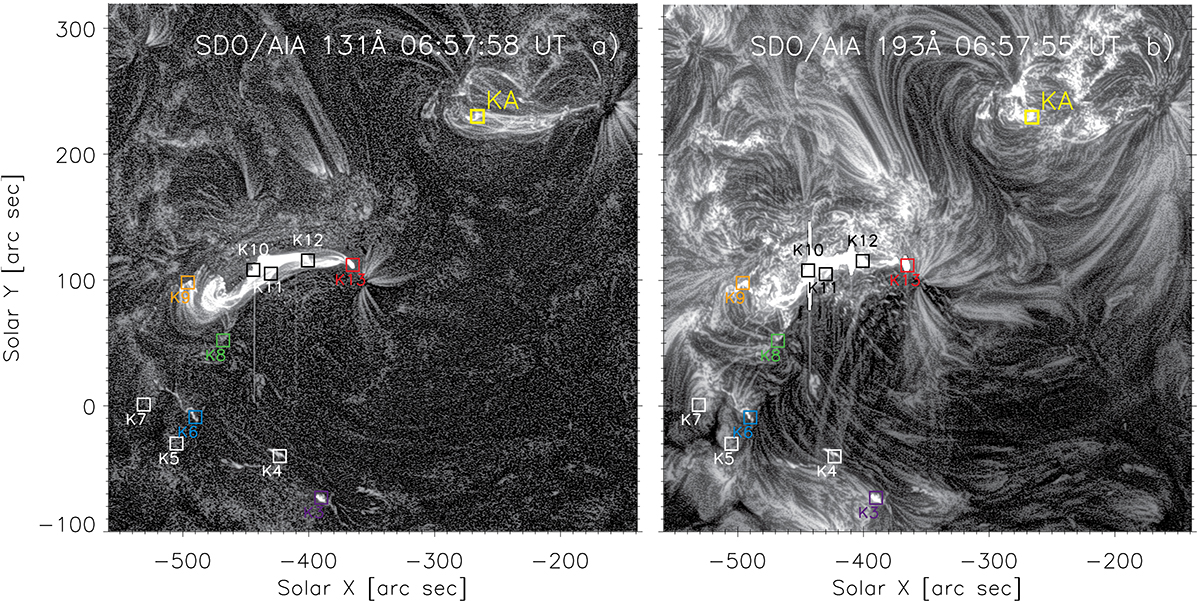
View of flaring active region NOAA 12 056 and neighbouring NOAA 12 055. (a) 131 Å filter showing bright loops in NOAA 12 055 next to kernel KA (yellow square). (b) 193 Å filter showing interconnecting loops between the two active regions between flare kernel K13 (red square) and kernel KA (yellow square). Kernels K3–K13 from C8.7 flare are depicted in both panels as square regions. The yellow square marked KA is the region from which light curves are shown in Fig. 11. The temporal evolution of the C8.7 flare (06:45–07:45 UT) in SDO/AIA filters 131 Å and 193 Å, and its connection to the neighbouring active region is available as an online movie (aa50641_24movie_01.mpg).
Current usage metrics show cumulative count of Article Views (full-text article views including HTML views, PDF and ePub downloads, according to the available data) and Abstracts Views on Vision4Press platform.
Data correspond to usage on the plateform after 2015. The current usage metrics is available 48-96 hours after online publication and is updated daily on week days.
Initial download of the metrics may take a while.