Open Access
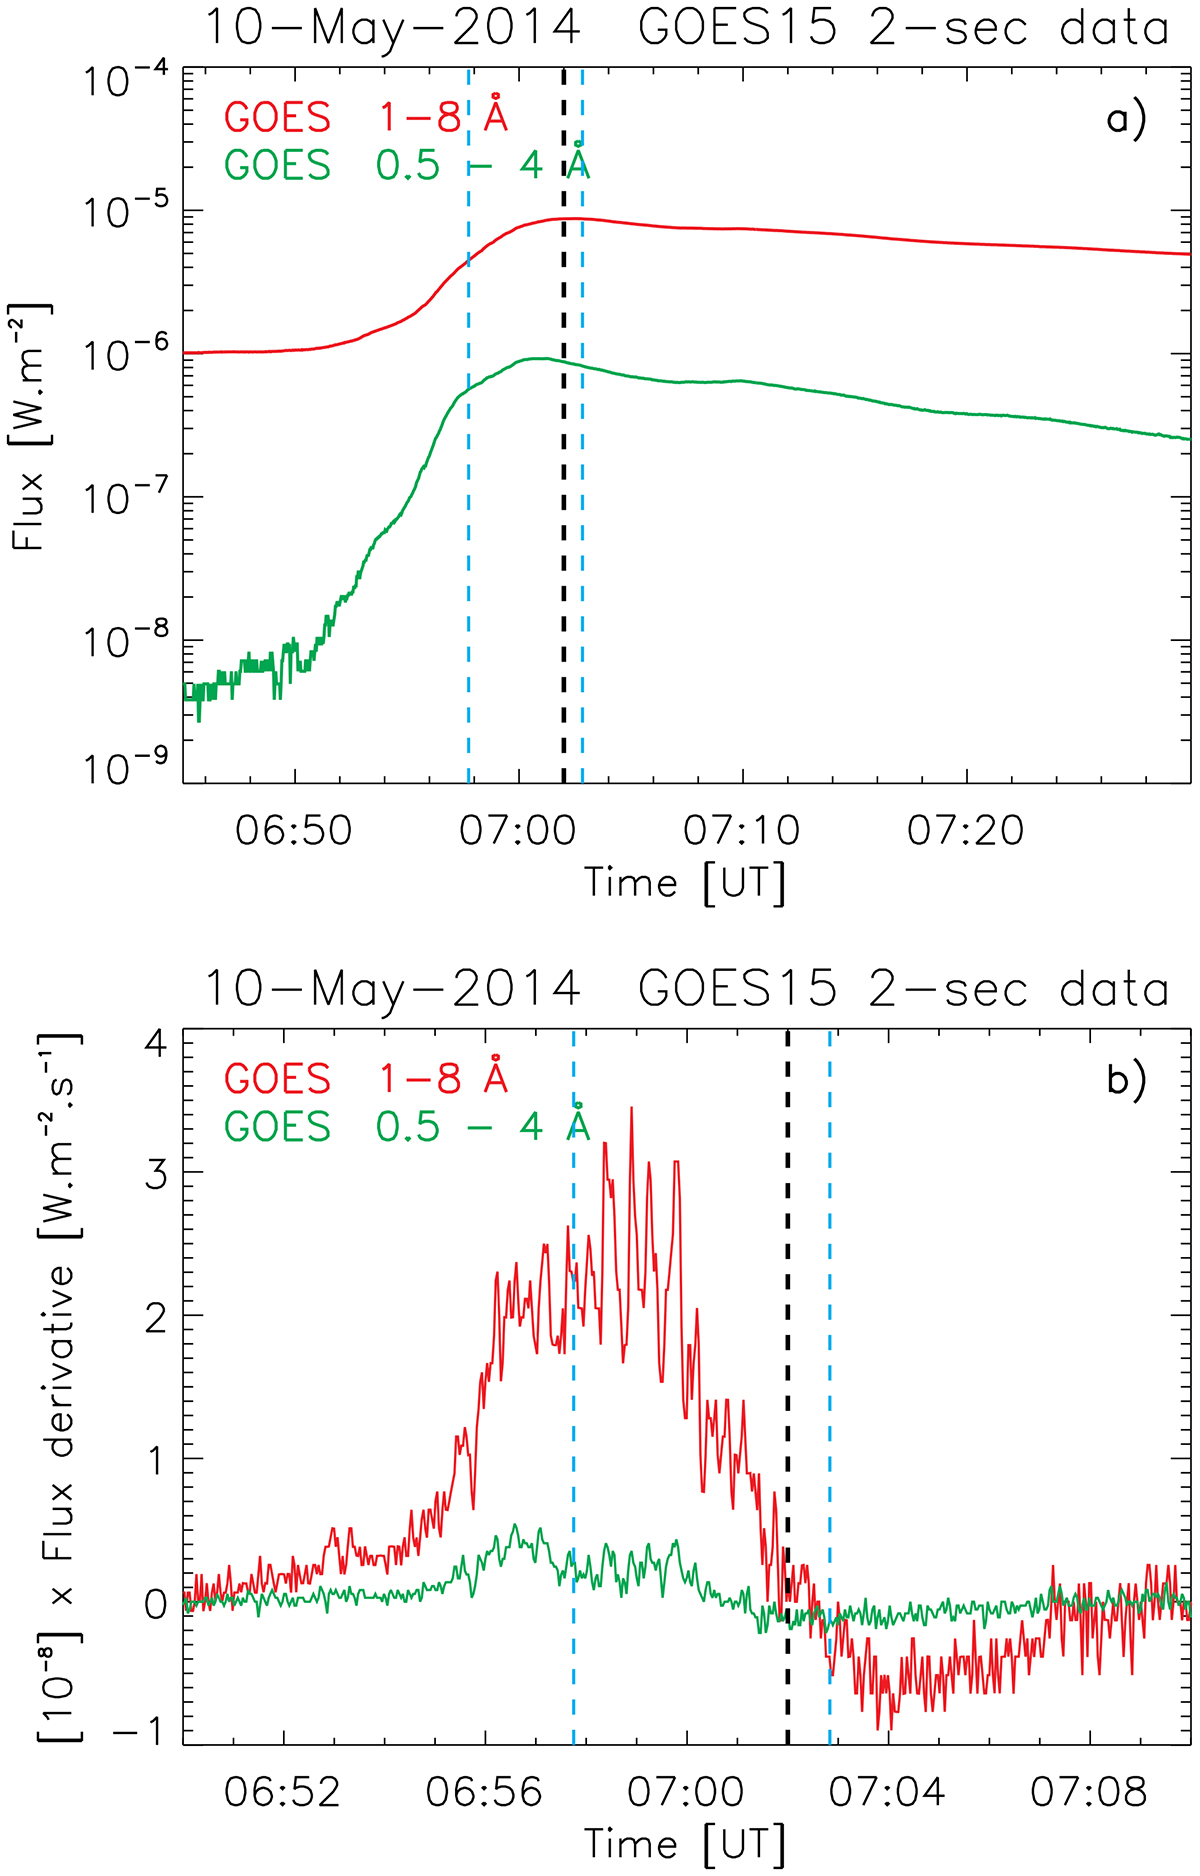
Fig. 1.
Download original image
GOES 15 light curves. (a) Flux in 1–8 and 0.5–4 Å during the time interval 06:45–07:30 UT and (b) flux derivative during the time interval 06:50–07:10 UT. Blue vertical dashed lines show the time interval when radio bursts were observed and the black line marks the flare maximum in SXR.
Current usage metrics show cumulative count of Article Views (full-text article views including HTML views, PDF and ePub downloads, according to the available data) and Abstracts Views on Vision4Press platform.
Data correspond to usage on the plateform after 2015. The current usage metrics is available 48-96 hours after online publication and is updated daily on week days.
Initial download of the metrics may take a while.