Fig. 6
Download original image
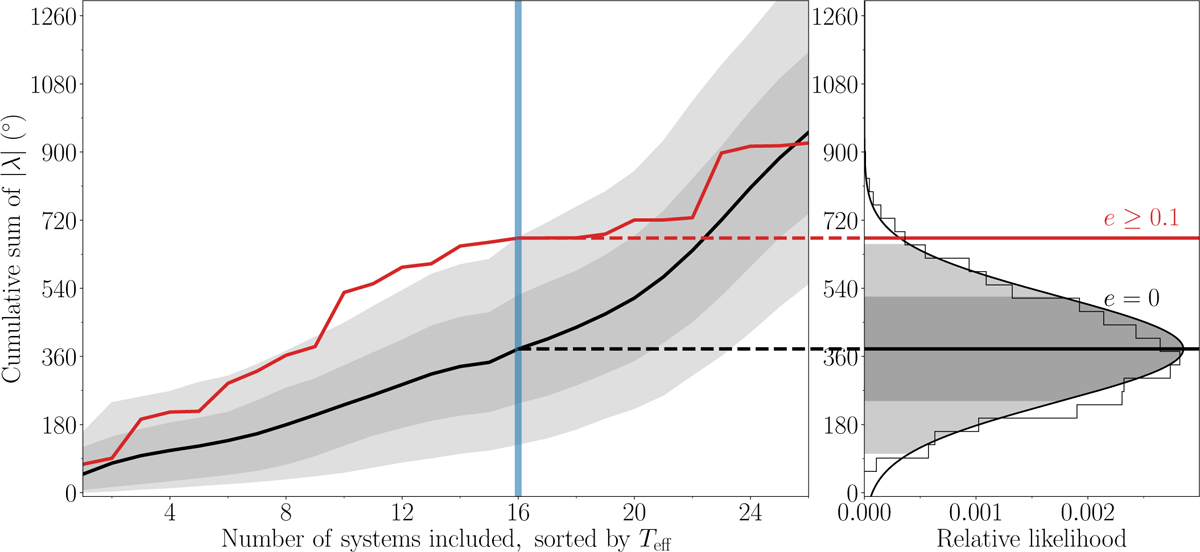
Obliquity distribution for stars hosting planets on eccentric and circular orbits. Left: the cumulative sum of |λ| for eccentric planets shown in red, sorted by Teff. The black line is the average of 5000 randomly sampled sets from the circular population with the gray shaded area denoting the 1σ and 2σ intervals. The vertical blue line denotes the Kraft break (Teff = 6100 K). Right: histogram showing the distribution of the circular population and the value of the eccentric population at the Kraft break. The Gaussian is a fit to the histogram. The circular and eccentric samples only differ by 2.1 σ, meaning the eccentric population does not appear to be significantly more misaligned. Adapted from Rice et al. (2022).
Current usage metrics show cumulative count of Article Views (full-text article views including HTML views, PDF and ePub downloads, according to the available data) and Abstracts Views on Vision4Press platform.
Data correspond to usage on the plateform after 2015. The current usage metrics is available 48-96 hours after online publication and is updated daily on week days.
Initial download of the metrics may take a while.