Fig. 4
Download original image
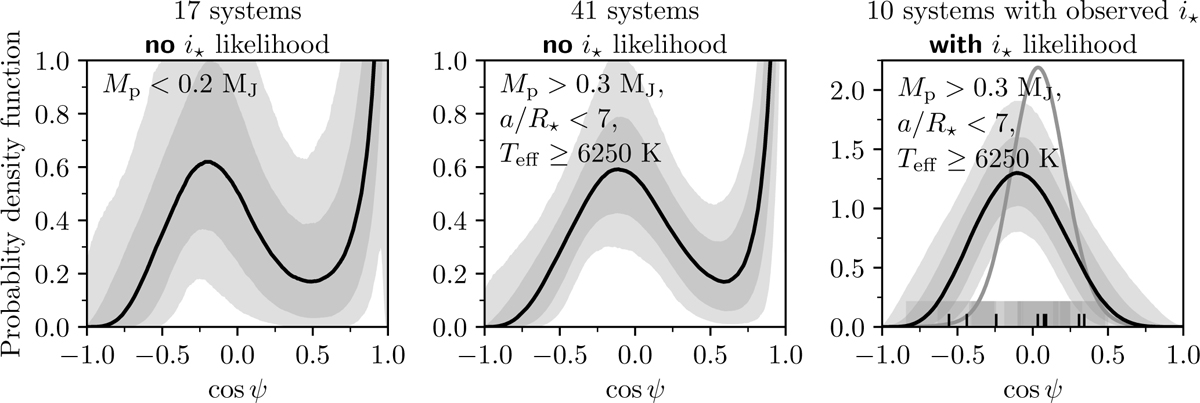
Hierarchical Bayesian inference of the obliquity distribution for subsets of the sample that are suspected of being especially prone to misalignment. The left panel is for all sub-Saturns with λ measurements, without using any i★ information even when it is available. The middle panel is for all hot Jupiters around hot stars with λ measurements, without using any i★ information even when it is available. The right panel is for hot Jupiters around hot stars for which both λ and i★ are known and utilized. In the right panel, the black upward tick marks on the horizontal axis are the individual values of cos ψ, and the horizontal bands surrounding the tick marks convey the uncertainties. The solid gray curve is a KDE estimated from these measurements.
Current usage metrics show cumulative count of Article Views (full-text article views including HTML views, PDF and ePub downloads, according to the available data) and Abstracts Views on Vision4Press platform.
Data correspond to usage on the plateform after 2015. The current usage metrics is available 48-96 hours after online publication and is updated daily on week days.
Initial download of the metrics may take a while.