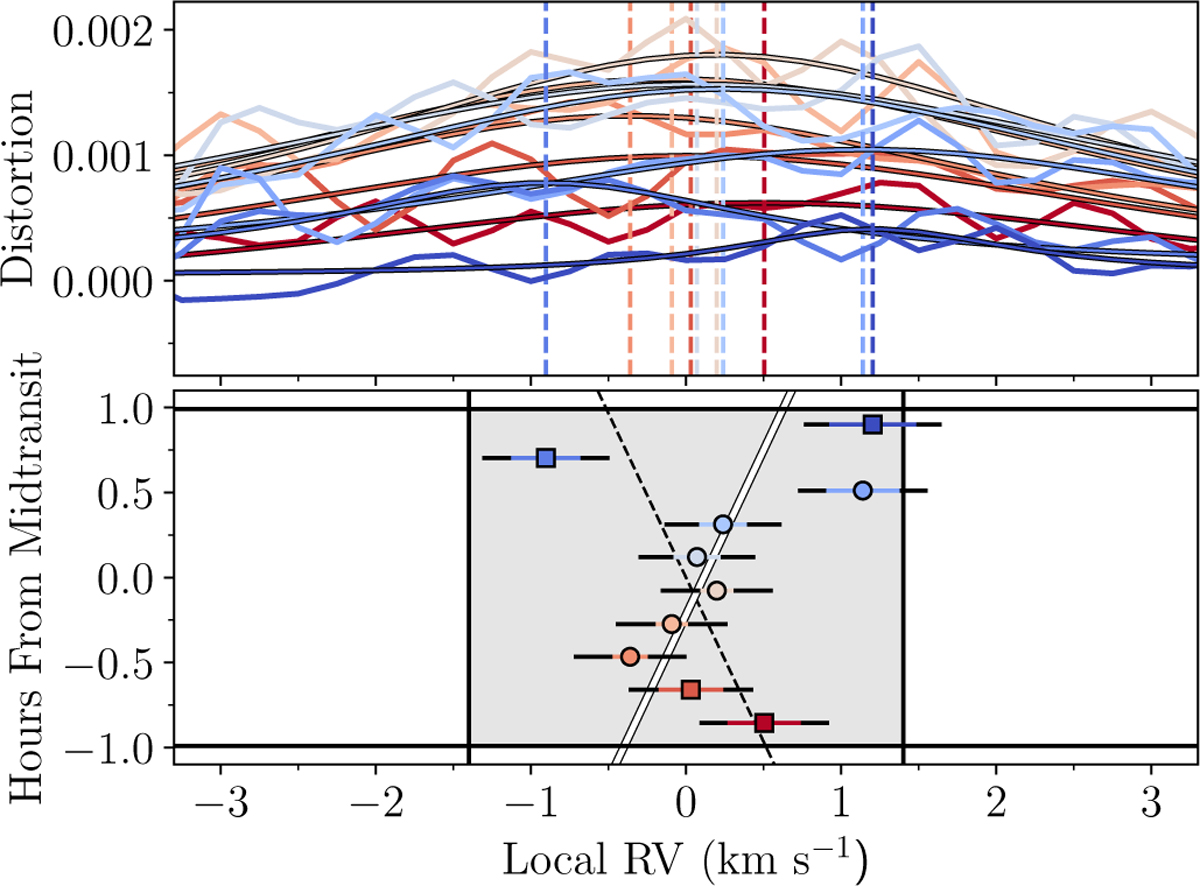
Fig. A.16
Download original image
Subplanetary velocities for TOI-1130. In the top panel the distortion from subtracting the in-transit CCF from the out-oſ-transit are shown as colored (wiggly) lines. Lines of corresponding colors with a black outline are (Gaussian) fits to the distortion in order to extract the position of the distortion denoted by the dashed vertical line. The bottom panel shows the location of the distortion plotted around the midtransit time. The squares denote epochs for which the decrease in flux from the transiting planet is less than 0.75%. The solid white (black dashed) line shows a model for an (anti-)aligned configuration.
Current usage metrics show cumulative count of Article Views (full-text article views including HTML views, PDF and ePub downloads, according to the available data) and Abstracts Views on Vision4Press platform.
Data correspond to usage on the plateform after 2015. The current usage metrics is available 48-96 hours after online publication and is updated daily on week days.
Initial download of the metrics may take a while.