Open Access
Fig. A.8
Download original image
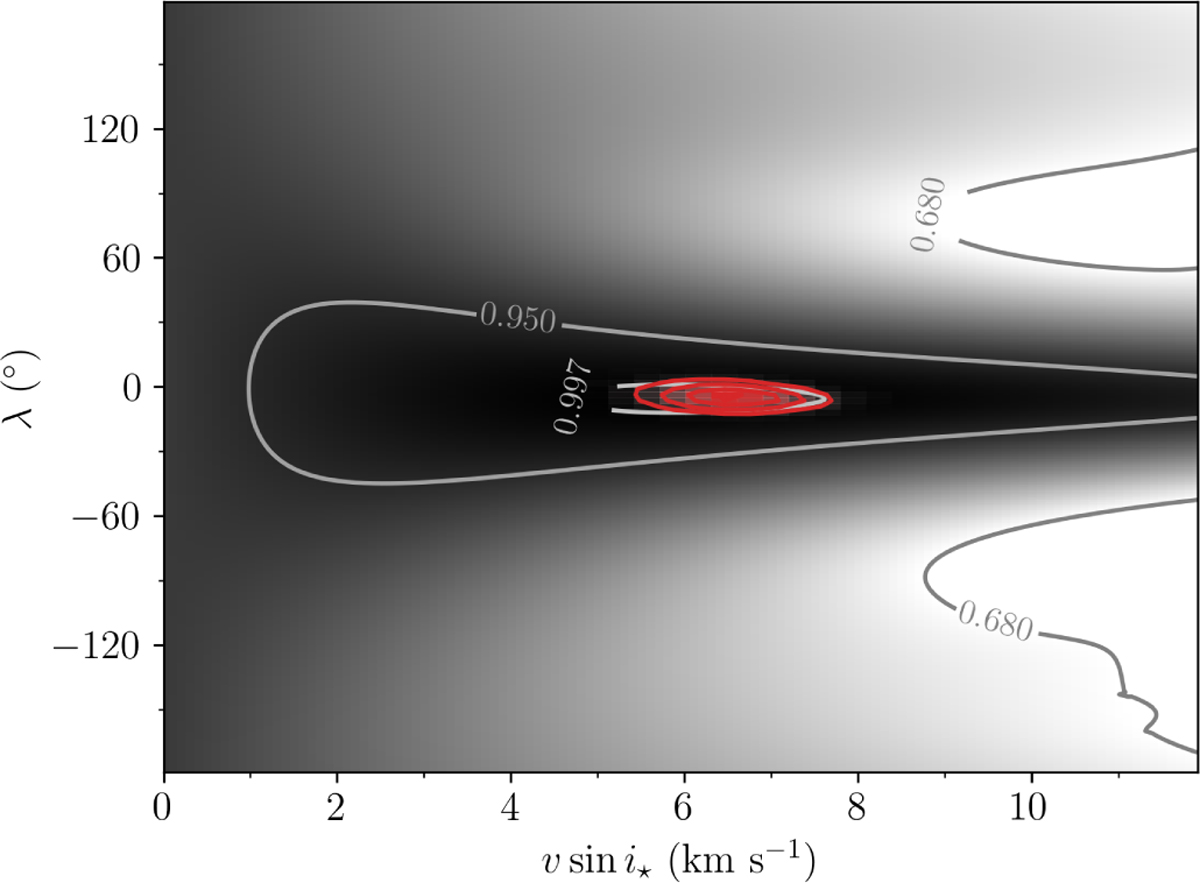
Peak of the stacked CCFs of KELT-3. The peak of the stacked CCFs of KELT-3 created by assuming the best-fitting value of b from the RV-RM fit. The gray contours show a peak around (v sin i⋆,λ)=(6.0 km s−1, 1.0°). The red contours are the same as created from the posterior shown to the right in Fig. A.7.
Current usage metrics show cumulative count of Article Views (full-text article views including HTML views, PDF and ePub downloads, according to the available data) and Abstracts Views on Vision4Press platform.
Data correspond to usage on the plateform after 2015. The current usage metrics is available 48-96 hours after online publication and is updated daily on week days.
Initial download of the metrics may take a while.