Fig. 4
Download original image
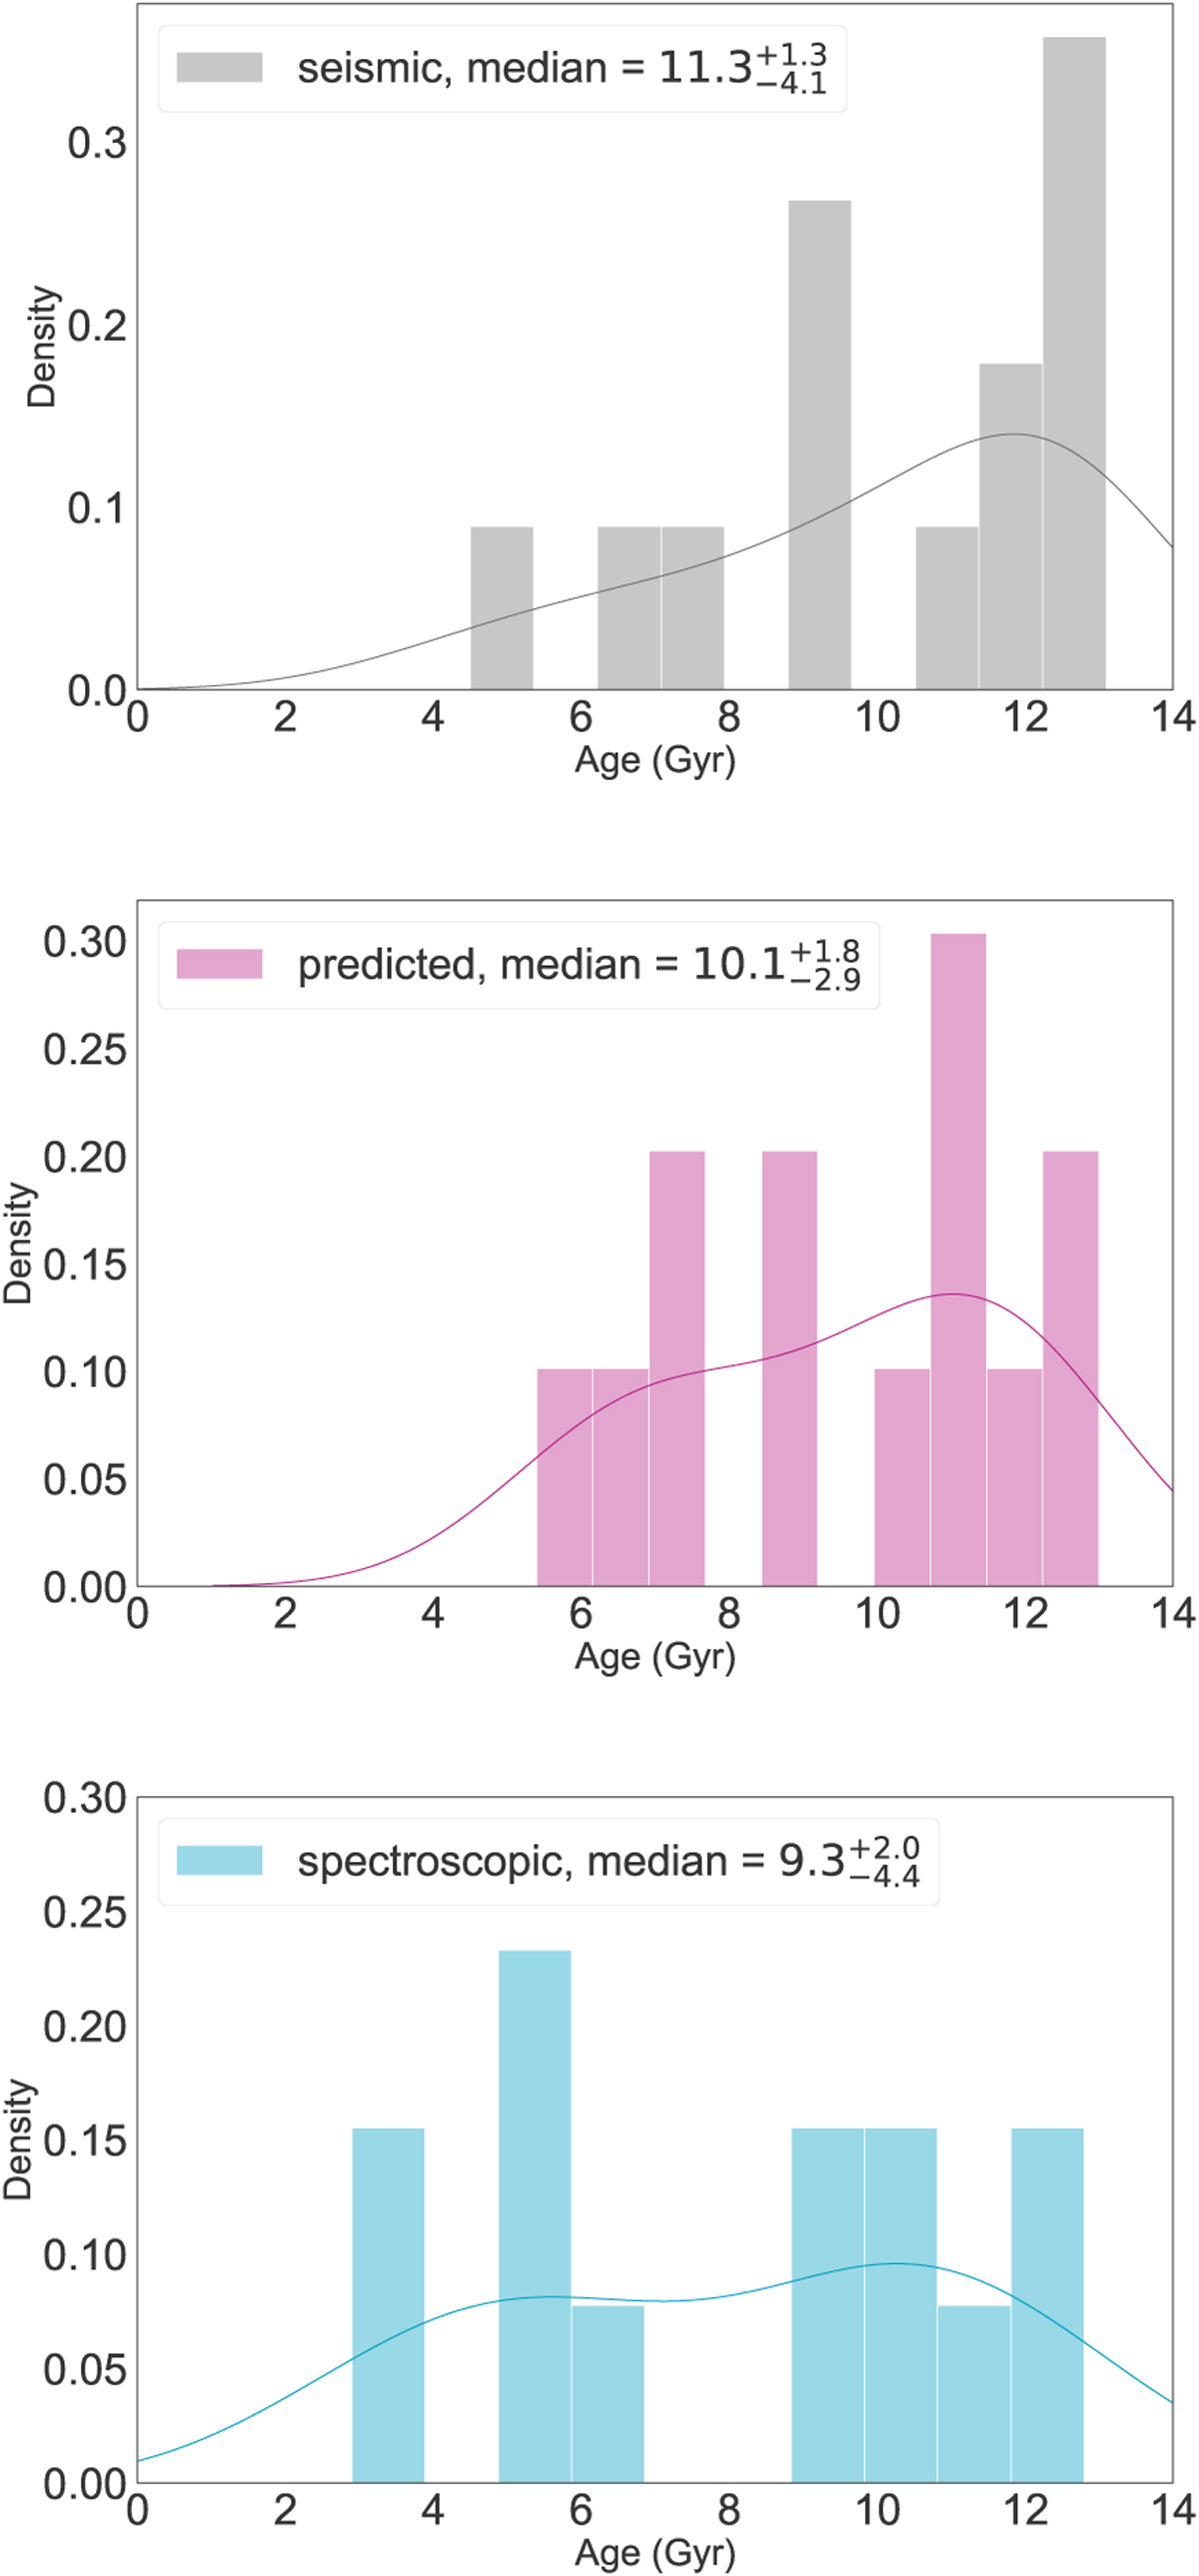
Age distribution for the three cases studied in this work using BASTA. The top panel (gray) shows stellar ages calculated using the seismic information νmax and Δν. The middle panel (pink) shows stellar ages calculated using the predicted log ɡ. The bottom panel (blue) shows the stellar ages calculated using the spectroscopic log ɡ. Median values as well as lower and upper uncertainties are indicated in the label.
Current usage metrics show cumulative count of Article Views (full-text article views including HTML views, PDF and ePub downloads, according to the available data) and Abstracts Views on Vision4Press platform.
Data correspond to usage on the plateform after 2015. The current usage metrics is available 48-96 hours after online publication and is updated daily on week days.
Initial download of the metrics may take a while.